Most mornings for months on end, a white streak grows out of the side of a Martian volcano called Arsia Mons. It stretches west for up to 1,800 kilometers, then evaporates before the afternoon. For years, computer models couldn't reproduce it. The one that finally does lets ice crystals form straight out of water vapor, with no speck of dust to start on, something nobody has caught happening in any planet's atmosphere before.
Later tonight there's a lava planet that may be shaded by clouds of rock. The last story is my favorite: one line in a Chinese chronicle from 709 BCE that helps measure how Earth's spin has changed.
1. ☁️ A Martian cloud that may need no dust at all
Arsia Mons is one of the giant volcanoes of Mars, a broad cone about 20 kilometers tall a little south of the equator. Through spring and summer in the planet's southern hemisphere, something happens on its western side nearly every morning. Before sunrise, a knot of water-ice cloud starts to form over the slope. Then it stretches. For about two and a half hours its tail runs west at around 170 meters per second, some 45 kilometers above the planet's reference level, the Martian equivalent of sea level, until the cloud is as much as 1,800 kilometers long. By the afternoon it has evaporated. The next morning it does it all again.
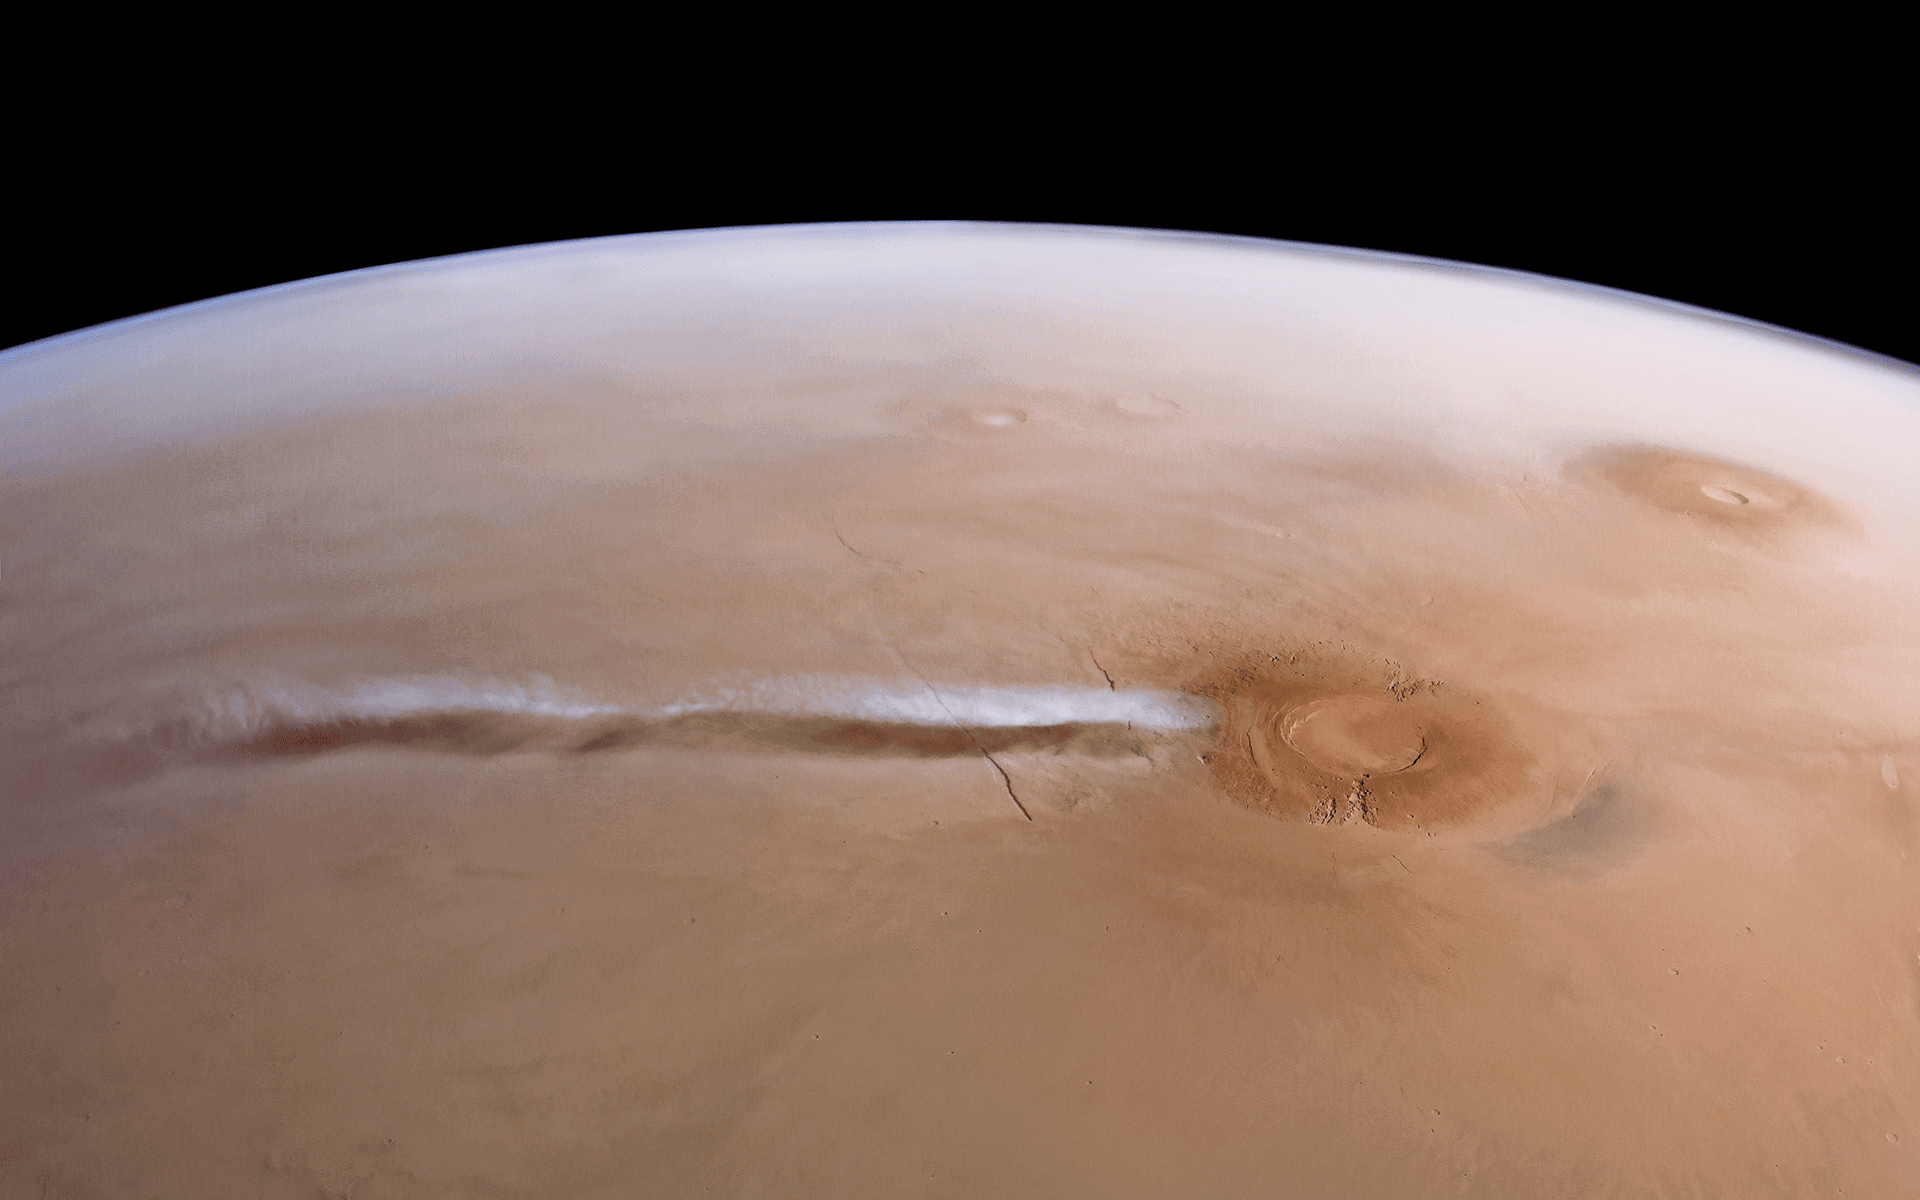
ESA's Mars Express orbiter began following it closely in September 2018, just after a dust storm had wrapped the whole planet, and its small monitoring camera photographed it hundreds of times over the following weeks. ESA pointed out at the time that it had nothing to do with an eruption. It was an orographic cloud, the kind that forms when wind is pushed up and over a mountain, like the cap of cloud that can sit on a peak on Earth.
It had been coming back every year for decades, mostly unnoticed. Most spacecraft orbiting Mars pass over any given spot in the afternoon, by which time the cloud is gone. When Jorge Hernández-Bernal and his colleagues went back through older pictures, they found it in images from several missions, as far back as NASA's Viking 2 orbiter. They named it the Arsia Mons Elongated Cloud.
Explaining it turned out to be hard. In a follow-up study, the team ran a detailed weather model of the region. In the model, wind pours down the volcano's western slope and then leaps upward, a little like water in a river jumping after it rushes over a weir. That jump sends a powerful updraft high into the atmosphere, and the air at 40 to 50 kilometers cools by up to 30 degrees Celsius. The model got the cloud's head right, in the right place at the right time of day. But the tail never grew, and the cloud came out far too thin.
The answer the team settled on involves how ice gets started. Air can briefly hold more water vapor than it can keep at a given temperature, a state called supersaturation. It builds up when air cools faster than condensation can remove the extra vapor, even when dust is around. In Earth's clouds, water usually condenses first onto tiny particles of dust, salt or soot, and ice then grows on particles or forms when droplets freeze. Ice appearing directly out of the vapor, with no seed at all, is called homogeneous nucleation from vapor. A handful of water molecules have to bump together by chance into a cluster big enough to survive, which only happens when the air is enormously supersaturated. It has been treated as a textbook possibility that doesn't happen in real atmospheres.
The earlier simulations held a clue. The updraft over Arsia Mons chilled the air so fast that the vapor became extremely supersaturated, but only for a moment, too briefly for ice to grow on dust grains. Hernández-Bernal, with Anni Määttänen, Aymeric Spiga and François Forget, added ice forming straight from vapor to the model. A long cloud formed on its own, and it grew and changed through the morning much like the real one.
"Water vapour turns directly into icy cloud particles without any middle step," Hernández-Bernal said. "It's akin to droplets of condensation appearing in the middle of a room, rather than on a window."
It takes conditions nobody had seen on Mars. Relative humidity compares the water vapor in the air with the most the air could hold at that temperature before it starts to condense, so 100 percent is the usual tipping point. According to ESA, this process needs relative humidity more than 100,000 times what we experience in everyday life on Earth. Mars's air holds very little water, but colder air can hold far less, so chilling it fast enough sends the ratio soaring. The updraft lifts moist air several kilometers in a few minutes, and the temperature can fall by 30°C in about 10 minutes. "We've not seen these conditions on Mars before, but our finding now strongly suggests that the planet's humidity can indeed reach these extreme levels," he said.
Scientists had proposed that ice could form this way high in the atmospheres of Earth and Venus, but it has never been caught in the act anywhere. "Understanding this exotic martian cloud required exotic physics," said Colin Wilson, ESA's project scientist for Mars Express.
The evidence comes from a model, and the paper's title, published in Nature Geoscience on October 7, says the clouds "suggest" this kind of ice formation. Nobody has measured the humidity inside the real cloud, and some details of the simulated one still don't match the pictures. What the team has shown is that their model makes the cloud only when ice is allowed to form from vapor alone.
2. 🕳️ A jet in our galaxy that may point almost straight at us
For years, three different radio surveys kept showing the same lopsided shape in the plane of the Milky Way: a bright core with a single lobe sticking out to the east, and nothing on the other side. The source was IRAS 18293−0941, a star system hidden behind so much dust that it had barely been studied since 2010, when it was suggested to be a massive star with a compact partner. Josep Martí of the University of Jaén and his colleagues thought the missing half might be the whole point.
Jets from black holes come in pairs, fired in opposite directions at close to the speed of light. When one of them points nearly at us, its light is thrown forward and its changes are squeezed in time, an effect called Doppler boosting. The approaching jet can look many times brighter than it really is, and it flickers faster. The jet going the other way is dimmed until it can vanish. In distant galaxies, a supermassive black hole with a jet aimed at us is called a blazar.
The Milky Way has smaller jet-makers called microquasars: pairs of stars in which a black hole or neutron star a few times the Sun's mass pulls gas off its companion and fires jets of its own. Since the late 1990s, astronomers have expected a few of them to point a jet our way, and they called these hypothetical objects microblazars. The candidates proposed so far haven't survived a closer look, or showed the effect only briefly during an outburst, as the black hole system 4U 1543−47 recently did. "It is the first time that we have a serious candidate," Martí told Live Science.
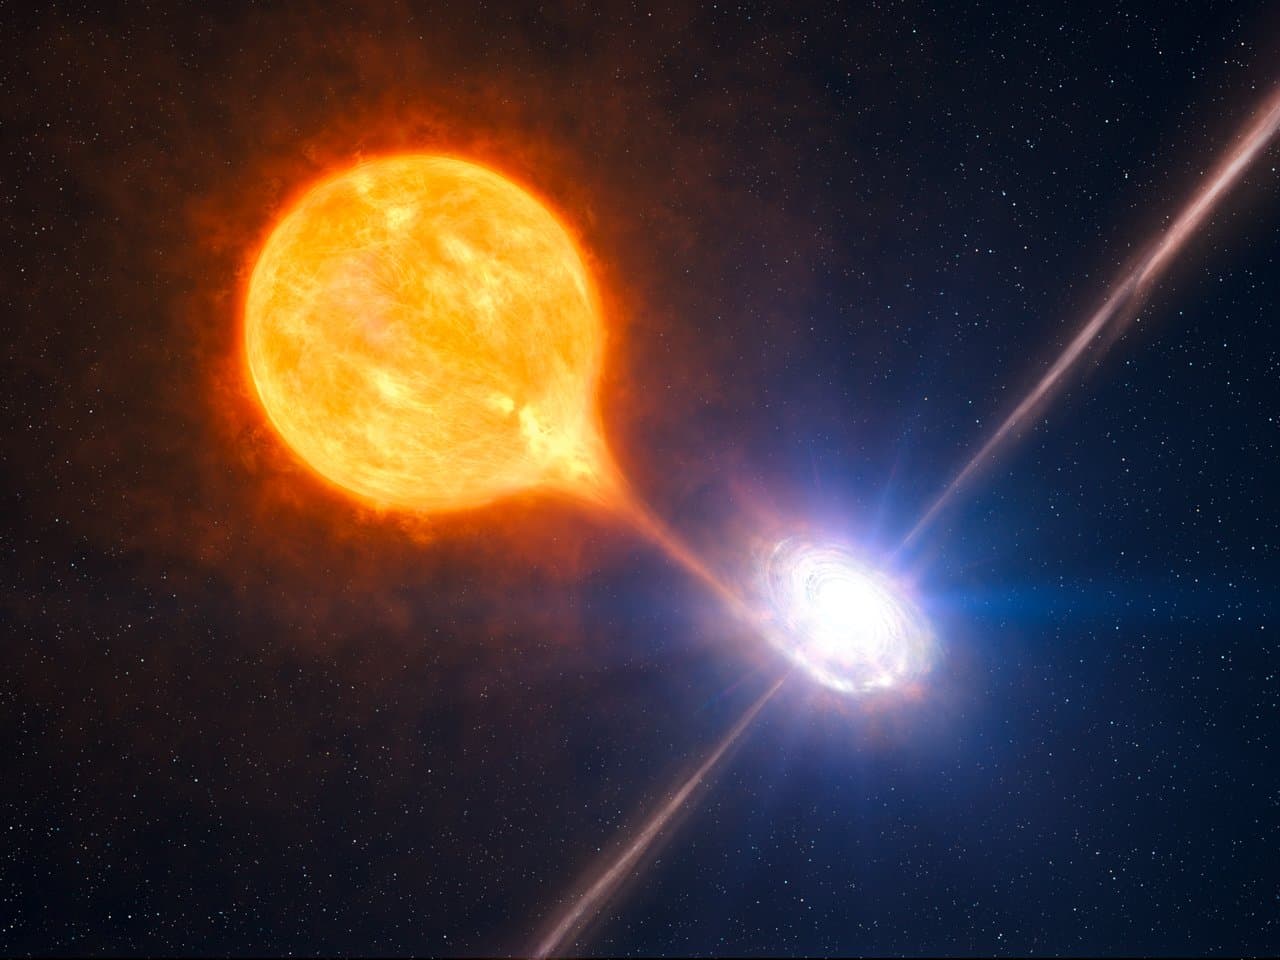
A lopsided radio source could easily be a distant galaxy, so the first job was to prove this one lives in the Milky Way. The European VLBI Network, a set of radio dishes spread across continents that works as one giant telescope, resolved the core into a small jet pointing the same way as the lobe. Its position matched, within the uncertainties, the position of the star measured by the Gaia spacecraft. The jet comes from the star system. Its visible spectrum shows no redshift either, so it isn't a galaxy far behind.
Next came the angle. Monitoring the system's starlight over a long stretch, the team found a pattern repeating about every 5.69 days. They read it as a star stretched into an egg shape by its partner's gravity, which brightens twice per orbit, so the orbit itself would last 11.38 days. The swings are tiny, about 2 percent, and the stars never eclipse each other. Seen from nearly above the orbit, a stretched star shows us almost the same area all the way around; seen more from the side, that area would change a lot more. The team thinks we're seeing the orbit nearly face-on, probably tilted by 30 degrees or less. If the jet is launched at right angles to the orbit, as is usually assumed, it should point within about 30 degrees of us, which fits the missing jet on the other side.
The surroundings tell the rest of the story. The star is wrapped in an expanding envelope of gas and dust. Far-infrared images from the Herschel space telescope show dust swept into a shell along the jet's direction. On the far side, the jet moving away from us seems to slam into a dense cloud of molecular gas, where radio and glowing hydrogen mark a shock. The jet heading toward us spreads out into thinner gas. That cloud also gives the best distance: about 12,000 light-years, much closer than earlier estimates, which had assumed all the dust dimming the star lay between it and us.
One expected feature is missing. Blazars flicker fast, and this system doesn't, at least not in its starlight over an hour. The team's explanation is that the light we see comes mostly from the star and its dusty envelope, which would smooth out quick changes from the jet. That's plausible, but it's an argument for why a test failed, and the team calls the object a candidate.
There's a bigger claim too. In the same patch of sky, the LHAASO observatory in China has recorded a source of gamma rays, the most energetic kind of light, above 100 tera-electronvolts. An electronvolt is a unit of particle energy, and a tera-electronvolt is a trillion of them, so each of these photons carries more than seven times the energy of a proton–proton collision at the Large Hadron Collider. In the team's model, protons accelerated in the jet crash into the dense cloud and make particles called pions, which decay into gamma rays at those energies. The region is crowded, though, with pulsars, rapidly spinning neutron stars, that could also contribute, and the catalog itself flags possible confusion between sources.
The model has a black hole at the center, swallowing gas faster than the Eddington limit, the rate at which the light from infalling gas pushes outward about as hard as gravity pulls in, and driving a jet at about three-quarters of the speed of light. That's the team's interpretation; the measurements so far don't weigh the compact object. Kinwah Wu of University College London, who wasn't involved, said "the claims and the results of the paper are sensible and there are no questionable hidden assumptions." Martí noted why such objects are rare: "The microquasar phase of evolution is very short, and so it is difficult to find one in that phase." The team is now checking whether the bright spot where the far jet meets the cloud really is a hotspot.
3. 🪐 Could clouds of rock shade a lava planet?
TOI-561 b goes around its star in less than 11 hours. It orbits less than 1.6 million kilometers out, a fortieth of Mercury's distance from the Sun. That's so close that astronomers expect the same side to face the star all the time, and the ground there must be molten. It's about 1.4 times as wide as Earth. That makes it an ultra-short-period planet: a world no more than twice Earth's size that orbits in a day or less. Roughly one Sun-like star in 200 has one.
Its star is odd too. It's a little smaller and cooler than the Sun, about 280 light-years away in the constellation Sextans, and around 10 billion years old, twice the Sun's age. It belongs to the Milky Way's thick disk, an older population of stars, and it's poor in iron. "It must have formed in a very different chemical environment from the planets in our own solar system," said Johanna Teske of Carnegie Science.
A planet like this should be bare rock. Starlight this fierce ought to strip away any gas it had long before the system reached its age, and most of the rocky planets Webb has examined so far look bare, though most of those orbit small red stars. But TOI-561 b is too light. Its density is about 4.3 grams per cubic centimeter. "It's not a super-puff, but it is less dense than you would expect if it had an Earth-like composition," Teske said. It might have a small iron core and lighter rock, as you'd expect from an iron-poor star. Or a thick atmosphere might be making it look bigger than it is.
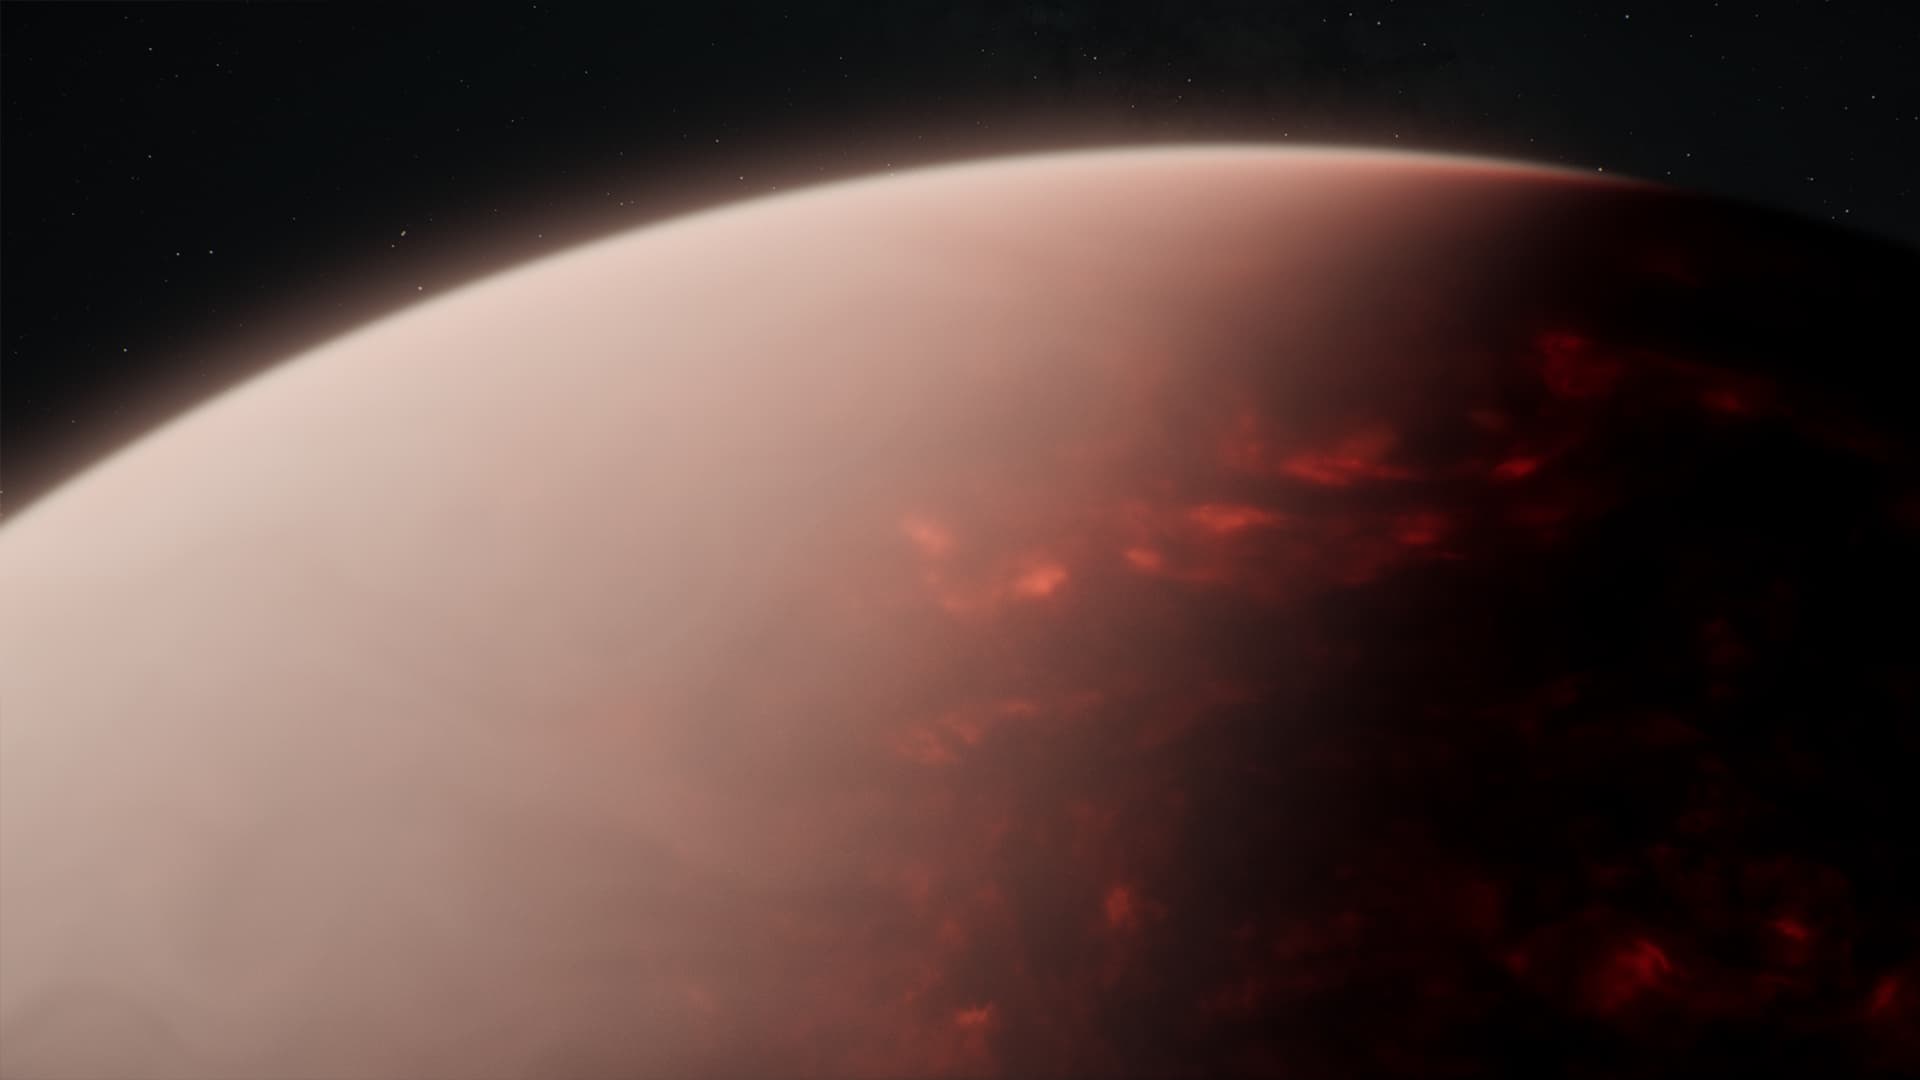
To find out, Webb watched the system for 37 hours straight in May 2024, nearly four orbits. Each time the planet slipped behind the star, the total light dipped a tiny bit, and the size of that dip gives the brightness, and so the temperature, of the planet's day side. If it were bare rock with nothing to carry heat away, the day side should be close to 2,700 degrees Celsius. It came out closer to 1,800.
"We really need a thick volatile-rich atmosphere to explain all the observations," said Anjali Piette of the University of Birmingham, one of the authors of that paper, published in December 2025. Volatiles are substances like water and carbon dioxide that turn to gas easily. Tim Lichtenberg of the University of Groningen put it more simply: "It's really like a wet lava ball."
That first analysis used only the moments around each eclipse. A second paper, led by Samuel Boucher of the Université de Montréal with Lisa Dang of the University of Waterloo, uses the whole 37 hours. It follows the planet's light all the way around its orbit, a measurement called a phase curve, which shows the night side as well as the day. The long, unbroken watch also let the team model the star's own slow flicker, from the boiling of its surface, so it wouldn't be mistaken for the planet.
A cool day side means heat is going missing. Either winds carry it to the night side, or the planet reflects starlight away before absorbing it. The night side, seen for the first time, isn't warm enough to account for the difference. Balancing the planet's energy budget, the team, in a paper now published in The Astronomical Journal, estimates that it reflects about 74 percent of the starlight that hits it, about as much as Venus does. The day side comes out at roughly 1,800 degrees Celsius. The night side is much more uncertain, probably around 800 degrees, so some heat does get there. When the team compared the data with computer models of the planet's climate, the models that came close had surface pressures of about 1 to 10 times Earth's, though the real pressure is still unknown.
Something has to do the reflecting, and the models point to clouds made of silicate minerals, the stuff of ordinary rock: silicon dioxide, the compound in quartz, and a magnesium silicate. They could form on the day side near the line between day and night and bounce starlight back to space before it reaches the magma. Clouds of rock, shading an ocean of molten rock.
Keeping an atmosphere for billions of years, this close to a star, is harder to explain. The team lists several ideas. The planet might have been born with an enormous supply of gas. Heavier gases might escape more slowly than the hydrogen that models usually consider. It might have moved inward late, after its star's most violent youth. Or the gas might have been stored inside the planet and slowly released. Lichtenberg described the last idea as a kind of breathing: "At the same time that gases are coming out of the planet to feed the atmosphere, the magma ocean is sucking them back into the interior," he said.
Nobody knows yet what the air is made of. It could be thick carbon dioxide, like Venus's, or rich in sulfur dioxide, the gas Io's volcanoes pour out. Dang says that's the next big question: whether the atmosphere is more like Venus's or like an extreme version of Io's. Webb could answer it by watching the planet again at longer infrared wavelengths, where carbon dioxide leaves a strong mark.
4. ⭐ A dead star with two rings of planet rubble
WD J1328−1450 is a white dwarf that glows too brightly in the infrared, a sign of warm dust around it. Nicola Gentile Fusillo of the University of Trieste and his colleagues spread its light into a spectrum in 2021, and again in 2023, with the X-shooter instrument on ESO's Very Large Telescope, to look for rock it might be swallowing. Instead, the bright calcium lines that come from gas around such stars had four peaks instead of the usual two.
A white dwarf is what a star like the Sun leaves behind: after it swells into a red giant and sheds its outer layers, its core remains, a dense ember about the size of Earth. Planets close to the star are swallowed on the way. Rocky bodies farther out can survive, and astronomers know they do because many white dwarfs have rock raining onto them, and some are surrounded by disks of dust. In a few of those disks, there's gas as well.
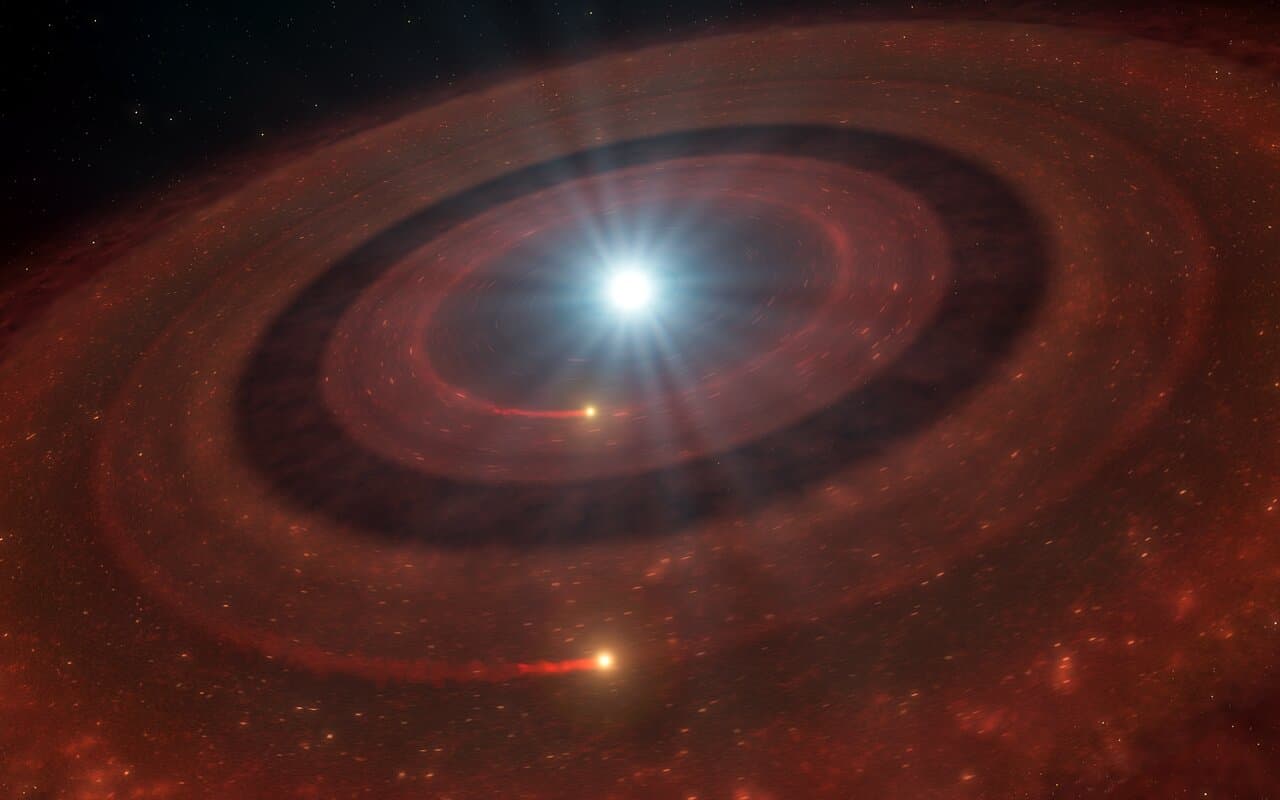
The gas gives itself away in the star's spectrum, as bright emission lines at particular colors. A ring of gas orbiting the star has one side moving toward us and the other moving away, so the Doppler effect pushes part of the light to bluer colors and part to redder ones. Each line splits into two peaks. All 21 gas disks found around white dwarfs before this one show exactly that.
The team can reproduce the four peaks with two rings of glowing gas. The inner ring orbits faster and makes the outer pair of peaks, and the slower outer ring makes the inner pair. Fitting the shapes, the team puts the inner ring between about 100,000 and 240,000 kilometers from the star, and the outer ring between about 380,000 and 1.3 million kilometers, with a clear gap in between. For scale, the Moon orbits Earth at about 384,000 kilometers. The line shapes stayed the same for more than two years, so this isn't a passing tangle.
"The two gaseous rings are remarkably stable and remain separated by a gap," said Felipe Lagos-Vilches of the University of Warwick and the Universidad Técnica Federico Santa María in Chile, a coauthor. "We have known for some time that planets may survive beyond the transformation of their central star, but this is the first example of a complex system with a double debris disc and potentially two surviving planetesimals," said Gentile Fusillo.
The rings aren't made of the same stuff, either. Magnesium glows in the inner ring but not in the outer one. If both had the same mix, the team would have seen it clearly. That points to two different parent bodies. Or it could be two layers of one body: on Earth, the mantle is rich in magnesium compared with calcium, and the crust much less so.
The puzzle is what keeps the gap open. Gas in these disks spreads outward over time, but as it moves away from the star and cools below about 1,200 to 1,500 kelvins, it condenses back into dust. So a ring of gas stays close to wherever it's being made. In the team's preferred explanation, two separate rings need gas to be made in two separate places. The usual explanations for where the gas comes from, dust evaporating at the inner edge of a disk or grains grinding against each other, have trouble leaving an empty band in the middle.
There's a precedent. Seven years ago, a team led by Christopher Manser, a coauthor here, found a signal repeating every 123.4 minutes in the gas lines around another white dwarf, SDSS J1228+1040. They read it as a solid body orbiting inside the disk, held together by its own strength and shedding gas as it moves through the dust. The new paper argues that WD J1328−1450 has two such bodies, one in each ring.
Close to a white dwarf, gravity's pull varies so steeply that a loose pile of rubble would be torn apart, so any survivor here must be solid enough to hold itself together. That sets a size limit. The inner body can be no bigger than a typical asteroid. The outer one, depending on where in its ring it sits and what it's made of, could be anything up to the size of Pluto or even our Moon.
The team considered other explanations. A single disk shaded in the middle by its own thick edge would look similar, but no model of these disks predicts it. Two white dwarfs too close to tell apart, each with its own disk, would require an unlikely coincidence. The star is also accreting only slowly for such a bright disk, which hints that the disk may be young and has been feeding the star for only a few hundred thousand years, in a chaotic early stage.
The rings look a lot like the bright rings and gaps in the disks around newborn stars, where planets are forming. Here, though, nobody has seen the bodies that would be carving them. Both are inferred from the shape of the light.
5. 🌌 The Giant Arc and the argument over seeing shapes
Modern cosmology rests on an assumption called the cosmological principle: on large enough scales, the universe looks about the same everywhere and in every direction. Up close there's plenty of structure. Galaxies gather into clusters, and clusters string along filaments around huge empty voids. But zoom out far enough and it should all even out, like a beach that looks smooth from a distance even though it's made of grains. The argument here is over whether some patterns are larger, or more tightly packed, than a universe like that should produce.
Alexia Lopez, then a doctoral student at the University of Central Lancashire, mapped the universe using quasars as backlights. Light from a distant quasar passes through the thin gas around galaxies on its way to us. Magnesium in that gas absorbs a particular color, and how much that absorption has been shifted to the red tells you how far away the gas is. Catalogs of these magnesium absorbers trace galaxies too faint to see directly.
In a paper posted in January 2022, Lopez and her adviser Roger Clowes, with Gerard Williger, reported a crescent of absorbers spanning about 3.3 billion light-years, in the direction of the constellation Boötes. They called it the Giant Arc. In January 2024 they added the Big Ring, about 1.3 billion light-years across and 4 billion around, only 12 degrees away on the sky. Both lie about 9.2 billion light-years away, as measured today. The universe has expanded while their light was on its way, so the light itself has traveled for less time than that, about half the universe's life. Across our sky, the ring would be about as wide as 15 full Moons.
"Neither of these two ultra-large structures is easy to explain in our current understanding of the universe," Lopez said. In her reading, cosmologists' calculations put the scale above which the universe should look smooth at about 1.2 billion light-years, and both are bigger. The team considered whether the ring could be a baryon acoustic oscillation, the faint shell-shaped pattern in how galaxies are spread out, left over from sound waves in the early universe. They concluded it was too big and not round enough. They mentioned more speculative possibilities too, such as cosmic strings, hypothetical cracks left over from the early universe, or Roger Penrose's idea of a universe that runs through repeating cycles.
Their evidence came as sigma values, a measure of how unlikely a pattern would be by chance under a particular statistical model. Higher means less likely, but the number depends on which test you run and how widely you searched. For the Arc, different tests gave between about 3 and 4.8 sigma. Finding a shape in a sparse scatter of points is a slippery business, because the answer depends on how you ask.
In February 2025, Till Sawala of the University of Helsinki and colleagues, including Carlos Frenk of Durham University, took up the challenge. They used FLAMINGO-10K, a very large simulation of a universe that follows the standard model exactly. Running the same methods that found the Arc on the simulated data, they reported that patterns like the Giant Arc are common there, and that the dense knots along the Arc were an artifact of the algorithm.
The method at the heart of the dispute works like connect-the-dots. Any two absorbers closer than a chosen distance get joined, and chains of joined points become structures. Pick a generous linking distance and long chains appear easily, even in random points. Lopez and Clowes replied that Sawala's team had used the wrong settings for the simulation, and with their own choices they found no structures that large in it at all. Sawala and Meri Teeriaho answered again, in a short paper titled "The Giant Arc: Filament or Figment?", that the reply's arguments didn't hold and that such patterns turn up even in perfectly uniform random points.
In April this year, Lopez and Clowes posted another preprint, describing what they call the Giant Ring, a larger loop that would link the Arc with another filament to the north and surround the Big Ring. It also contains a frank test. Their shape-fitting method, they found, produces impressive-looking ellipses in random data too, the familiar trap of searching everywhere until something turns up. But a different measurement, a two-dimensional power spectrum, which measures how strongly points cluster at each size scale, found clustering on scales of about a billion light-years at 3.5 sigma in the real data, while every random field and every patch of the simulation came out consistent with random.
I don't know which side is right, and I'm wary of any claim that rests on spotting shapes in thin data. People and algorithms both find faces in clouds. What would convince me is the same structure turning up in a completely different kind of map of the same part of the sky.
6. 💥 A likely supernova from 12.5 billion years ago, in slow motion
On May 28 this year, the James Webb Space Telescope photographed a small patch of sky for NEXUS, a program that keeps returning to the same fields to catch anything that changes. One galaxy there looked as it always had. On August 7, Webb looked again, and a new point of light sat beside the galaxy's center. On Earth, 71 days had passed between the two pictures. For the explosion, only about 12 had.
Ming-Yang Zhuang of the University of Illinois Urbana-Champaign and his colleagues measured the galaxy's redshift at 5.017. Its light left when the universe was about 1.15 billion years old, some 12.5 billion years ago. In their preprint, posted in September, they report AT 2026abck as a likely young supernova at that redshift, found without the help of gravitational lensing. The only spectroscopically confirmed supernova that far away, SN Eos, was magnified by gravitational lensing. "You have to observe the exact same tiny patch of sky repeatedly with [JWST], and the explosion has to happen at the right moment. We were lucky," Zhuang told Live Science.
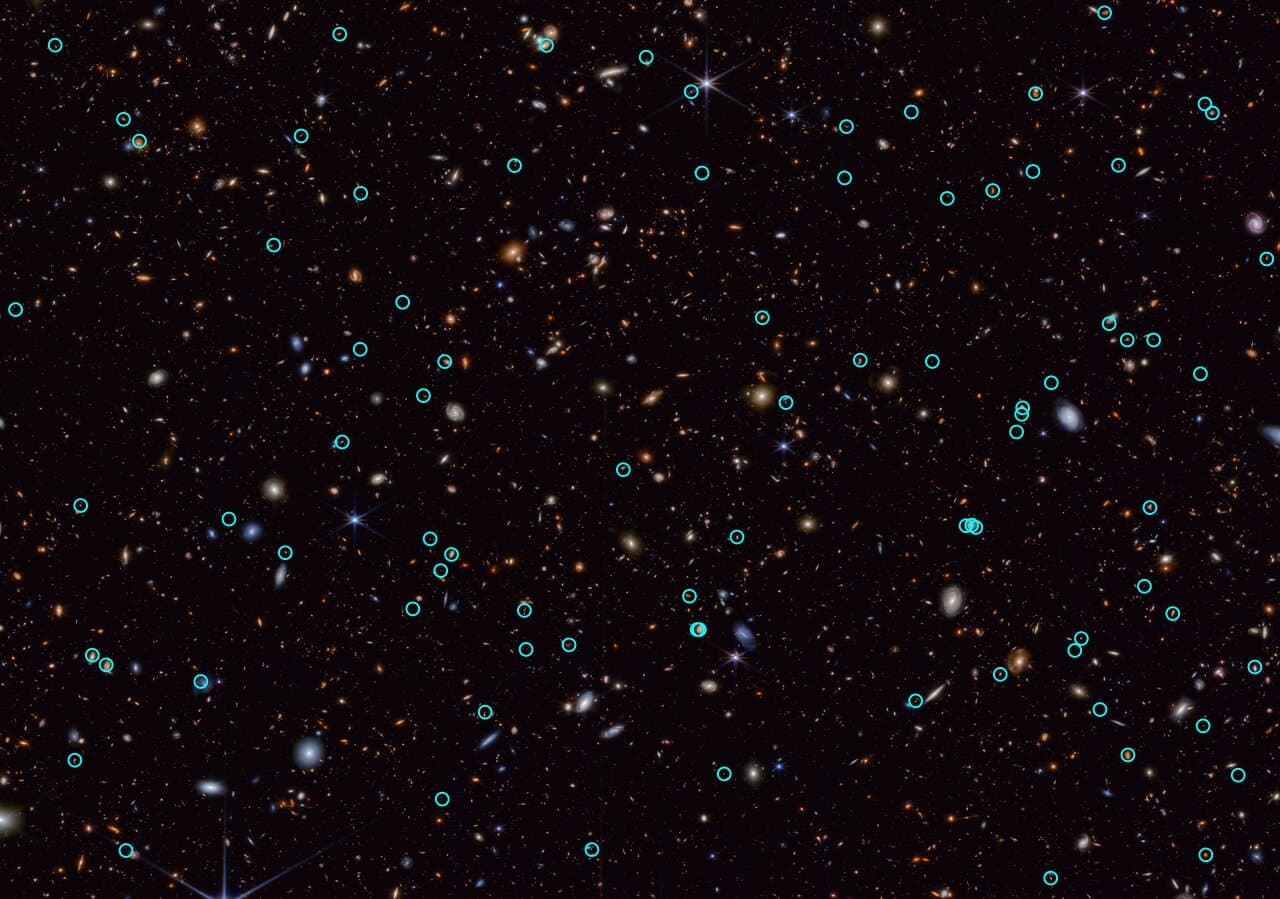
The new light at least tripled in brightness over no more than 12 days in its own time. It's hot, around 17,000 kelvins, and the glowing surface of the expanding debris is about 46 times as far from its center as Earth is from the Sun. When Webb caught it, it was giving off about 8 billion times the Sun's power, "almost as bright as the whole Milky Way Galaxy," said Xiaohui Fan of the University of Arizona, a coauthor. It sits off to one side of its galaxy and gives off a lot of ultraviolet light, which points to the collapse of a massive star, seen perhaps 4 to 10 days after it exploded. For an ordinary supernova of that kind at that age, it's unusually hot and bright. The galaxy holds about 6 billion Suns' worth of stars and is making new ones more than ten times faster than the Milky Way does.
The paper hasn't been peer reviewed, and there's no spectrum of the explosion itself yet, only of its galaxy. But the 71 days and the 12 days are worth a closer look, because the gap between them is one of the strangest effects in cosmology, and one of the best tested.
A redshift of 5.017 means the light's waves have been stretched by a factor of about 6 on the way to us, because the universe expanded while the light was traveling. Time stretches by the same factor. Think of the explosion sending out a flash every day. Each flash leaves a little later than the one before, and by then the universe is a little bigger, so it has farther to travel, and the gaps between arrivals grow. Everything about the event, its rise, its fading and the space between any two moments, reaches us drawn out sixfold. Twelve days there became 71 here.
It sounds like a theorist's footnote, but it's been measured. In 2024, the Dark Energy Survey compared how long 1,504 Type Ia supernovae, all thought to burn for about the same length of time, took to brighten and fade. The farther away they were, the slower they looked, in proportion to 1 plus the redshift, to within about 1 percent. The result rules out models in which the universe doesn't expand and light simply loses energy along the way. Quasars, whose brightness wanders irregularly, show the same slowing too, in 190 of them monitored for two decades.
At the distance of AT 2026abck, the stretching helps. An explosion's first days, the ones that reveal the most about the star that died, pass quickly at the source. Stretched across weeks, they're easier to catch for a telescope that returns every couple of months. What it still needs is a spectrum of the explosion itself, which would settle what kind of star blew up.
7. 🌍 A line from 709 BCE helps time Earth's spin
"In autumn, in the seventh month, on the renchen day, the first day of the month, the Sun was totally eclipsed." That line comes from the Spring and Autumn Annals, a chronicle of the state of Lu in eastern China. It uses the old Chinese calendar, in which renchen names one day in a repeating 60-day cycle. It records an eclipse on July 17, 709 BCE, seen from the court at Qufu, and it's the earliest written record of a total solar eclipse that can be securely dated. Rulers in ancient China employed people to watch the sky because unusual events were read as omens, signs that the ruler had done wrong. Their records became some of the best eclipse records in the world.
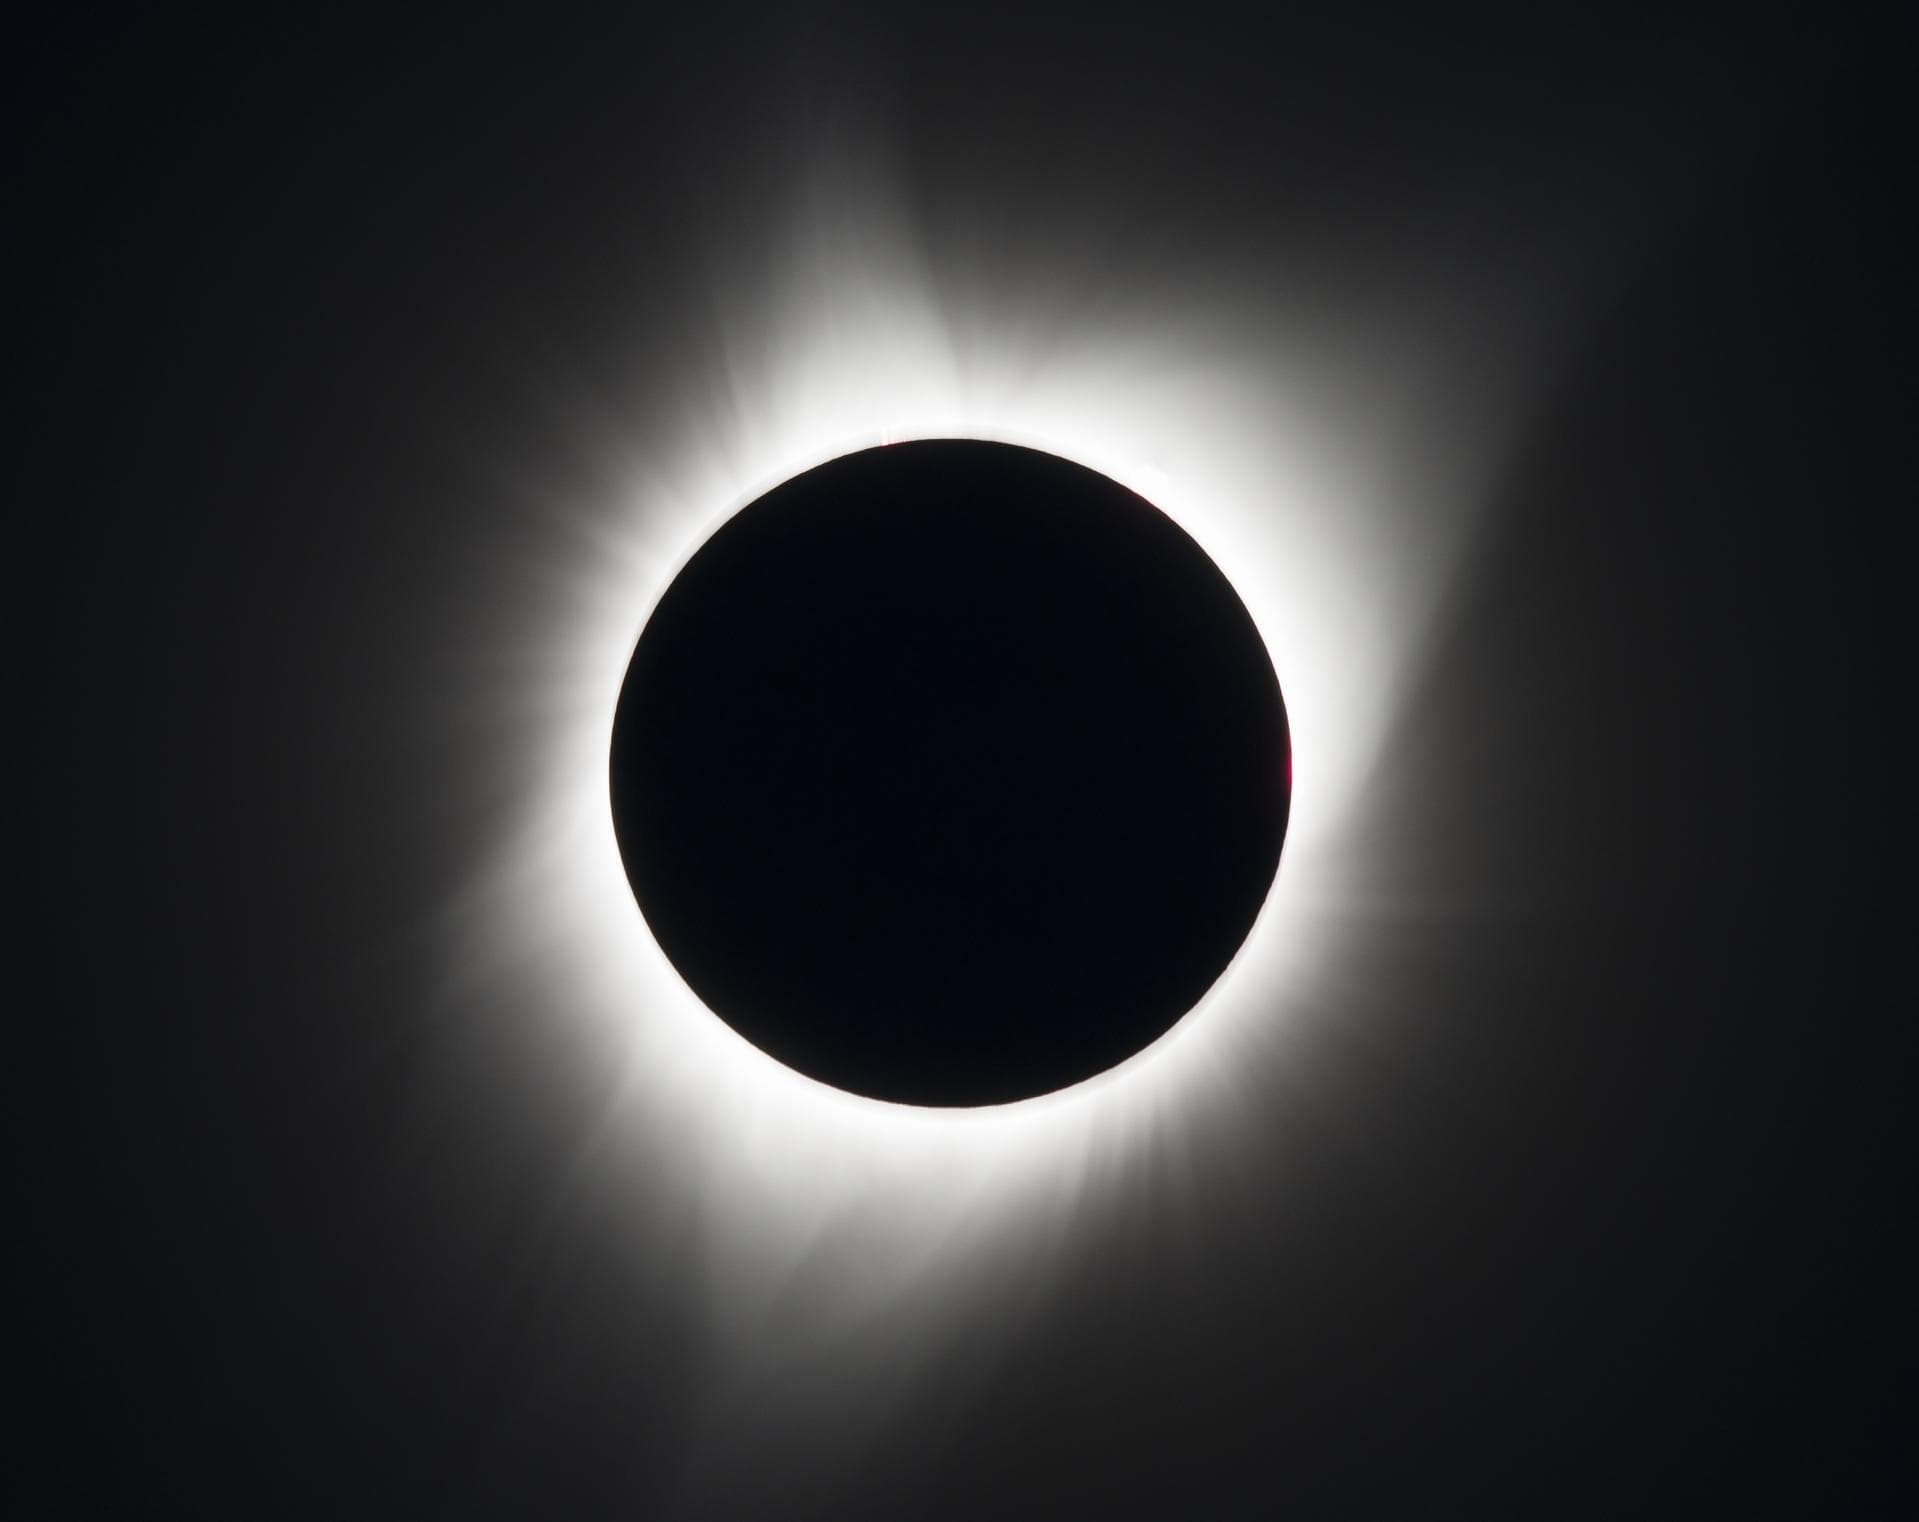
Records like this are valuable for a reason the scribes couldn't have guessed. The positions of the Sun and Moon can be calculated far back into the past with great precision. What's harder to know is which part of Earth was facing the Moon's shadow at the time, because Earth's spin hasn't been steady. Astronomers track the difference with a number called ΔT, or delta T. It's how far the time kept by Earth's turning has drifted from a perfectly uniform clock.
Around 700 BCE, ΔT is roughly 20,000 seconds, about five and a half hours. Earth turns 15 degrees in an hour, so if you ignored ΔT and timed the past with a perfectly uniform clock, you'd put that eclipse's shadow about 80 degrees of longitude away from where it really fell, more than a fifth of the way around the world.
The main cause is the Moon. Its gravity raises tides, and the friction of those tides acts as a brake on Earth's rotation, while the Moon slowly drifts outward. In a 2016 study, F. Richard Stephenson, Leslie Morrison and Catherine Hohenkerk combined records of eclipses from 720 BCE to 1600 CE, from Babylon, China, Greece, the Arab world and medieval Europe, with later timings of the Moon passing in front of stars. They found that the length of the day has grown by about 1.8 milliseconds per century on average. Tidal friction alone predicts 2.3. Part of the difference probably comes from Earth slowly changing shape as the land rises back up after the weight of ice-age glaciers was lifted, which speeds the spin up a little, and part from the planet's core and mantle tugging on each other.
A couple of milliseconds a century sounds like nothing. But tiny differences in the length of the day accumulate, day after day for about a million days, into hours of disagreement between uniform time and the time kept by Earth's turning. An eclipse seen from a known place pins that disagreement down. If the eclipse was total at a certain spot, ΔT must have been within a narrow range for the shadow to cross it. The 709 BCE eclipse was the earliest of the records without precise timings in Stephenson's study.
Hisashi Hayakawa of Nagoya University, who holds doctorates in both solar physics and oriental history, went back to it with Mathew Owens of the University of Reading, Mike Lockwood, Meng Jin of the Lockheed Martin Solar and Astrophysics Laboratory, and Mitsuru Sôma of the National Astronomical Observatory of Japan. At first the record didn't fit. Using the best existing estimates of Earth's rotation, a total eclipse shouldn't have been visible from Qufu at all.
The trouble started with the map. Checking archaeological excavation reports of the ancient city, the team found that earlier studies had placed Qufu about 8 kilometers from where it actually stood. At the corrected spot, the existing reconstruction of Earth's rotation gave only a partial eclipse, with the Moon covering 99.4 percent of the Sun's width at most. Slightly different calculations of the Sun's and Moon's positions played a part too. To make the recorded total eclipse fit, ΔT for 709 BCE has to fall between 20,264 and 21,204 seconds, about 100 seconds higher than the earlier estimate. Their paper appeared in The Astrophysical Journal Letters last December.
There's a second, shakier clue. The Hanshu, the official history of the Han dynasty, quotes a writer named Jing Fang, who lived about seven centuries after the eclipse, describing the eclipsed Sun as "completely yellow above and below." That has long been read as a description of the corona, which would make it one of the oldest. The team is careful here. Jing Fang didn't see the eclipse, his source is unknown, and the phrase may be a later interpretation tied to politics.
Still, they tested it. The corona's shape follows the Sun's activity. When the Sun is quiet, its long streamers tend to cluster around its equator. When it's active, they spread out in many directions, including toward its poles. Working out how the Sun's axis was tilted as seen from Qufu that day, the team found that a corona bright "above and below" fits an active Sun. That agrees with tree rings. Cosmic rays make radioactive carbon in the air, which trees take up, and an active Sun shields Earth from some of those cosmic rays, so the carbon in each year's ring tracks the Sun. The rings show it had just come out of a long quiet spell called the Homer or Neo-Assyrian Grand Minimum, from about 808 to 717 BCE. The eclipse came about eight years after it ended.
"Some of our ancestors were very skilled observers," Jin said. The court astronomers of Lu wrote down an omen. Twenty-seven centuries later, with the city moved 8 kilometers to where it belongs, their note helps pin down how far Earth's turning had drifted from a steady clock.
🌙 One last thought before you sleep
I keep coming back to those 8 kilometers. The line from Lu survived for twenty-seven centuries, but using it still meant knowing exactly where the court stood, and for years the calculations had it in slightly the wrong place. It took the reports of archaeologists digging up the old city to change an astronomical result.
That's all for tonight. Thanks for wondering along with me. Good night, and clear skies. 🌌
— Kasi