In November 1572, a star blazed up in Cassiopeia, as bright as Venus, and Tycho Brahe watched it fade. In 2008, astronomers caught some of that same light arriving late. It had bounced off a cloud of dust on the way, and it still carried the signature of the explosion. They pointed a telescope in Hawaii at it and spread it into a spectrum, its light sorted by wavelength, which Tycho never could.
Thousands of supernovae like it close the night, in a test of whether dark energy is running down. On the way there's a nearby planet cold enough that its sky may hold water-ice clouds, and something that may be leaking out from under Pluto's great glacier.
1. 💥 Tycho's supernova sent us a second copy
On November 11, 1572, Tycho Brahe noticed a star in Cassiopeia that hadn't been there before. It soon grew as bright as Venus. Others saw it too, across Europe and in the Middle East and East Asia, and it stayed visible to the naked eye for about 16 months, until it faded from view in March 1574.
What Tycho did with it changed astronomy. In the thinking of the time, the heavens above the Moon were perfect and unchanging, and anything new had to happen close to Earth, the way comets were then assumed to. Tycho looked for parallax, the small shift in position that a nearby object shows against more distant stars. He found none. The star had to lie far beyond the Moon, among the stars themselves, and the heavens could change after all. He published his findings in 1573 in a little book usually called De nova stella, "On the new star."
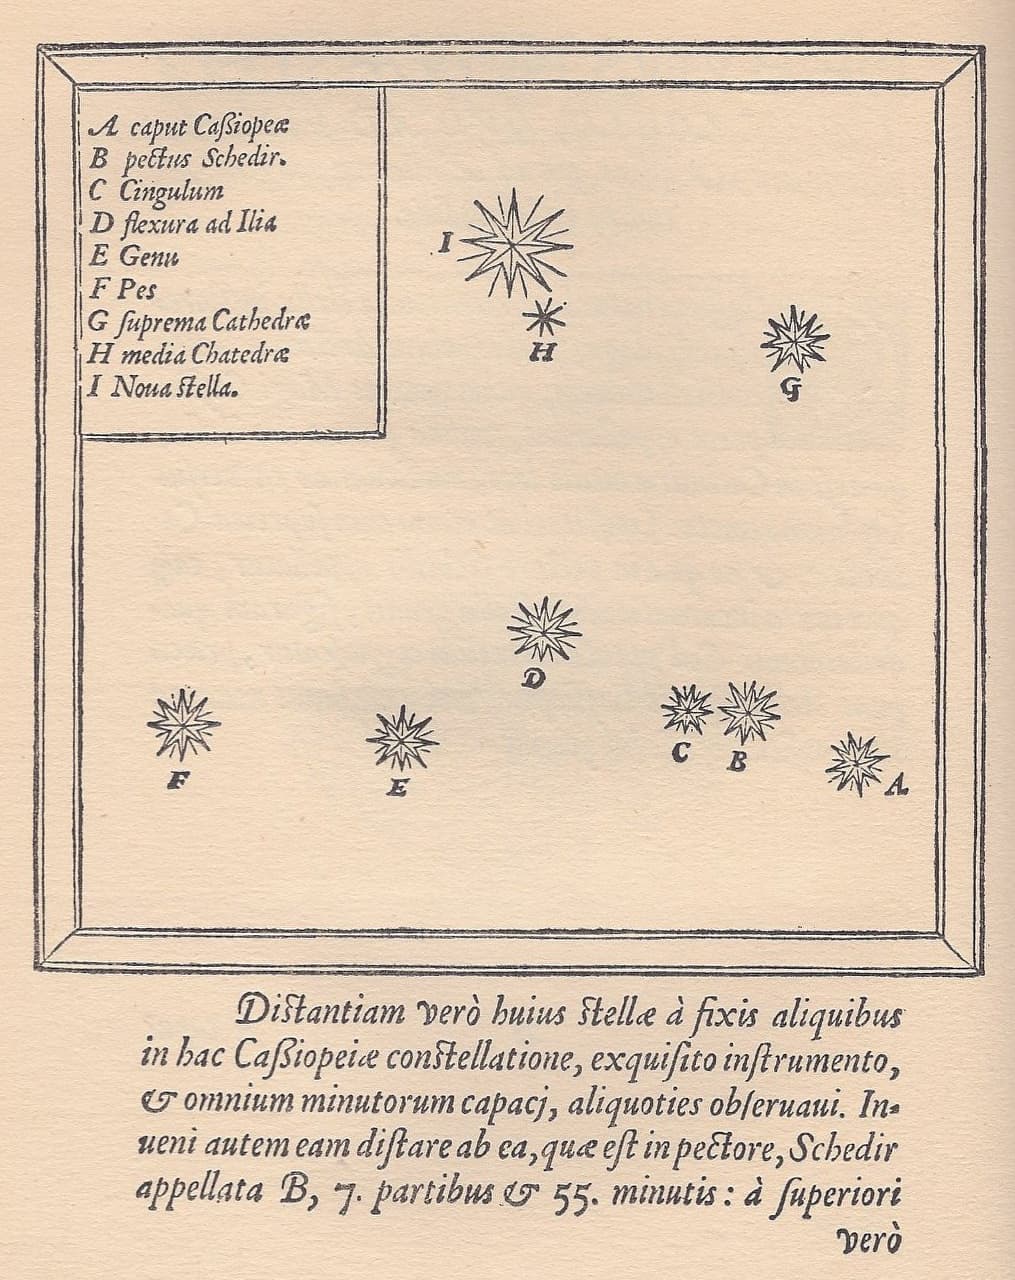
Not everyone agreed with him. The astronomer Jerónimo Muñoz suggested in 1573 that it was a comet coming straight toward us and then going away again, which would explain why it brightened and dimmed without seeming to move.
We now know Tycho saw a supernova. Walter Baade went back to the brightness measurements Tycho had recorded and showed, in 1945, that the way it faded matched what was by then known as a Type I supernova. Radio astronomers in the 1950s found the glowing shell of debris close to the position Baade had worked out. X-ray telescopes later showed that the remnant's chemistry looks like the debris of a white dwarf, the dense core a Sun-like star leaves behind, that had blown itself apart.
That kind of explosion, a Type Ia supernova, is a runaway nuclear explosion that destroys a white dwarf. Material from a companion star, or an encounter with another white dwarf, can set it off, though astronomers are still working out exactly how the ignition happens. Normal Type Ia supernovae peak at similar brightness, and the slower ones to fade are the brighter ones, so the way one fades tells you how bright it really was. Compare that with how bright it looks, and you get its distance. That makes them some of the best distance markers in astronomy. But the class has its oddballs, unusually bright or unusually faint ones. Without a spectrum of the explosion itself, nobody could say exactly which kind Tycho had seen.
Then the light came back. When a star explodes, its flash spreads out in every direction. Most of it races off into space, but some can hit a cloud of dust, scatter, and reach us by a longer path. Armin Rest and his colleagues went looking for that delayed light and, in 2008, reported faint arcs of it in the sky around Tycho's supernova and Cassiopeia A, another young remnant. These light echoes were the explosions' original light, scattered by dust clouds between the stars and arriving centuries after the direct flash. For Tycho's, the dust lies several hundred light-years from where the star exploded.
Oliver Krause of the Max Planck Institute for Astronomy and a team from Germany and Japan went after it. Their images showed the brightest patch shifting between August 23 and September 24, 2008, the way an echo should. On September 24 they aimed the 8.2-meter Subaru Telescope in Hawaii at it and spread its light into a spectrum.
"Using light echoes in supernova remnants is time-travelling in a way," said Tomonori Usuda of Subaru, "in that it allows us to go back hundreds of years to observe the first light from a supernova event."
The spectrum showed silicon and no hydrogen, the signature of a Type Ia near its peak. Compared with templates from supernovae in other galaxies, it fit the ordinary majority, neither too bright nor too faint. A few months earlier, the same team had used an echo to show that Cassiopeia A came from a collapsing massive star instead. There was one surprise: calcium moving faster than 20,000 kilometers per second, which the team took as a sign that the explosion wasn't perfectly round.
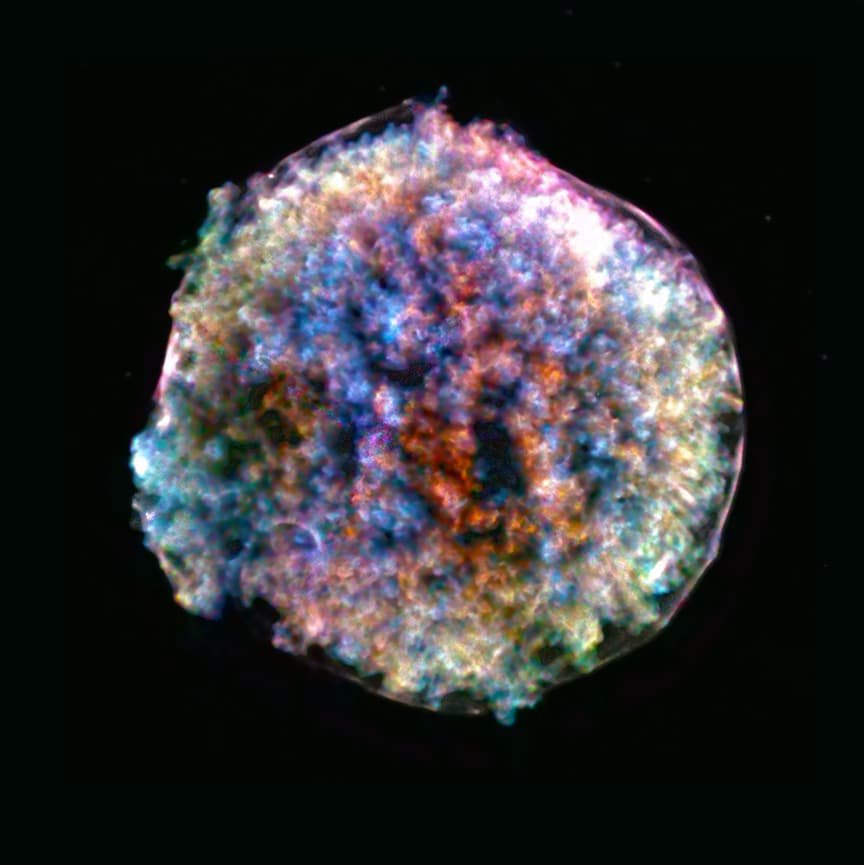
One question is still open. If the white dwarf was feeding on an ordinary companion star, that companion should have survived and been flung away at the speed it was orbiting. Pilar Ruiz-Lapuente's team proposed a candidate back in 2004, a star now called Tycho G, which moves unusually fast for its position. Later work with the Gaia spacecraft's precise distances found it is still the most dynamically peculiar star in the field, but that there is "no real proof" it's the one. If the explosion came from two white dwarfs merging, there would be no survivor to find.
The remnant is somewhere around 9,000 to 13,000 light-years away, depending on the method. The direct flash crossed that distance and reached Tycho in 1572. The light that went the long way round, by a cloud of dust, arrived when there were spectrographs and an 8-meter telescope waiting for it.
2. 🪐 Clouds of ice, maybe, on a Jupiter next door
Most planets that have been photographed directly are babies, young enough to glow strongly with heat left over from their formation. That glow makes them bright enough to spot beside their stars. A cold, grown-up planet like Jupiter is much harder to see.
Epsilon Indi A is a star a little smaller and cooler than the Sun, about 12 light-years away in the southern constellation Indus and of roughly the Sun's age. For years, it had been drifting in a way that hinted at a giant planet tugging on it: a slow change in its speed toward and away from us, plus a small shift in its position on the sky. "That's why our team chose this system to observe first with Webb," said Caroline Morley of the University of Texas at Austin.
Elisabeth Matthews of the Max Planck Institute for Astronomy led the search with Webb's mid-infrared camera, MIRI. Cold planets give off most of their light in the mid-infrared, which is extremely hard to observe from the ground, so it's a job for a telescope in space. A coronagraph inside the camera blotted out the star, and next to the dark spot sat a faint point of light. The team published the planet's picture in 2024.
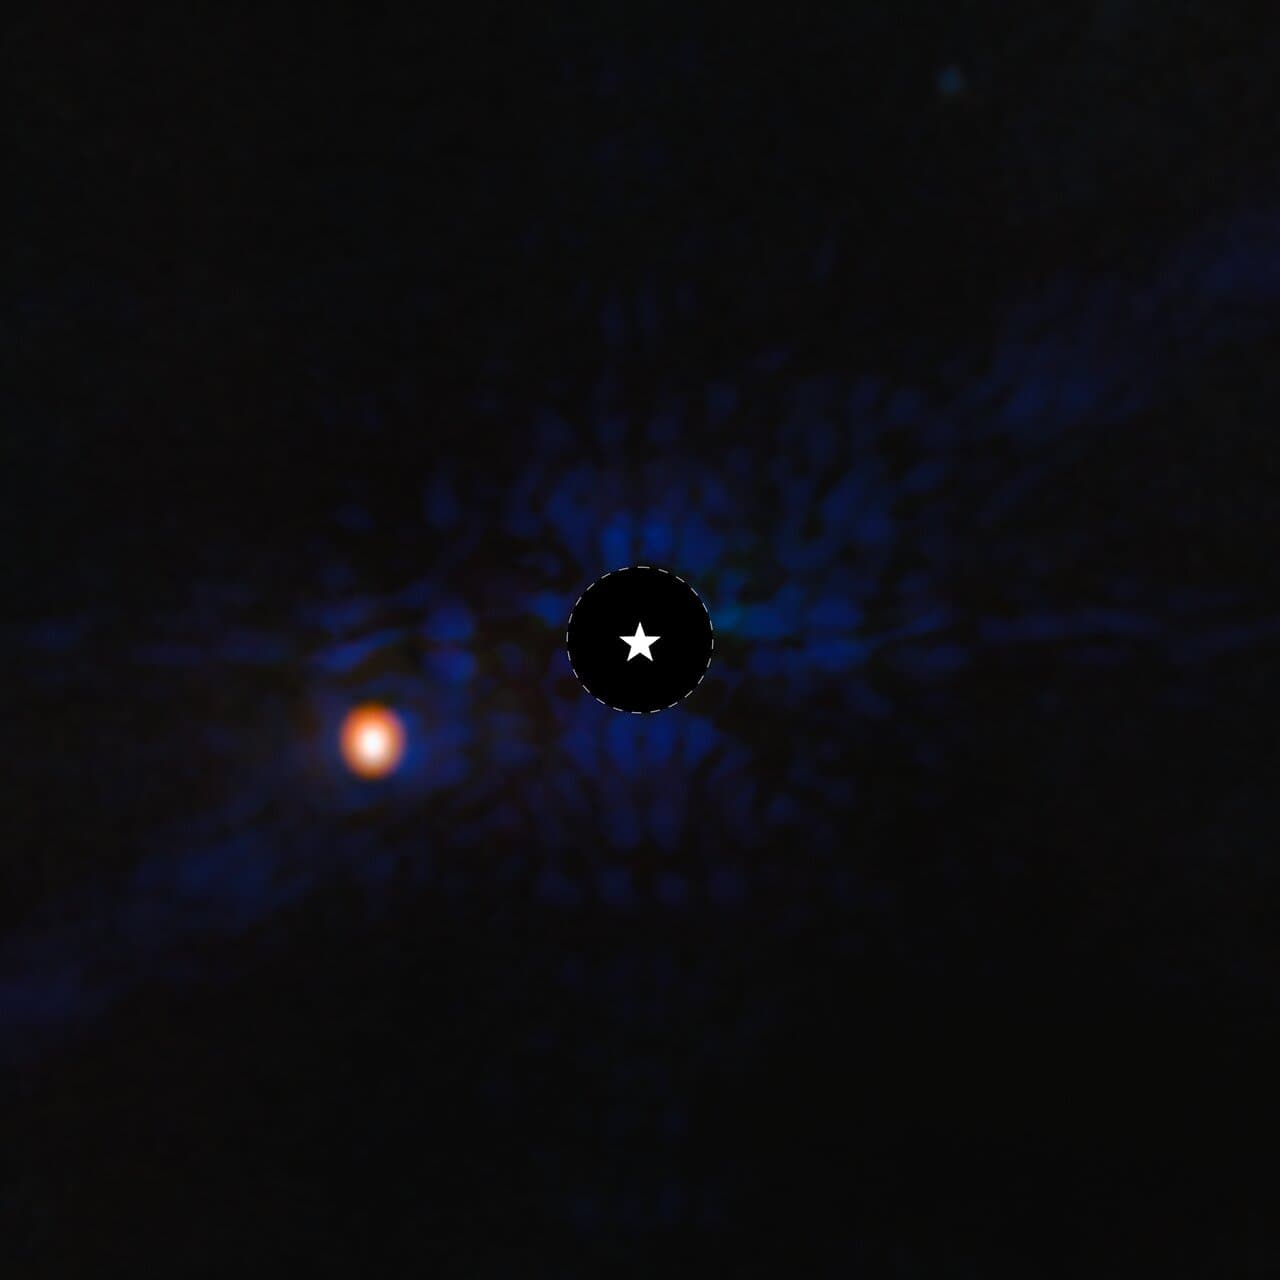
It wasn't the planet they had been told to expect. "It's about twice as massive, a little farther from its star, and has a different orbit than we expected," Matthews said. The team kept the old name, Epsilon Indi Ab, for the new object.
What stood out was the temperature. The planet came in at about 275 kelvins, around 2 degrees Celsius. That's an overall figure worked out from the heat it gives off; the air at different heights in its atmosphere will be warmer or colder. It made Epsilon Indi Ab the coldest planet ever imaged outside the Solar System, colder than every known free-floating brown dwarf except one (brown dwarfs are objects too small to keep up hydrogen fusion the way stars do), and only about 100 degrees Celsius warmer than the gas giants of our own Solar System. "Astronomers have been imagining planets in this system for decades; fictional planets orbiting Epsilon Indi have been the sites of Star Trek episodes, novels, and video games like Halo," Morley said. Now there was a real one.
There was a puzzle too. The planet was strangely dim at wavelengths between 3.5 and 5 microns, as if something in its atmosphere was swallowing that light.
Webb went back. In a paper published this year, Matthews's team added a new picture at 11.3 microns, a wavelength chosen because it sits just outside a band where ammonia absorbs. Comparing it with the earlier 10.6-micron image works like a test strip. The planet was clearly brighter at 11.3 microns, just outside the band, as it should be if ammonia is soaking up light inside it. That confirmed ammonia, the same molecule that forms Jupiter's top cloud deck.
But the ammonia signal was weaker than the models predicted. One explanation is that the atmosphere is short on nitrogen, or on what astronomers call heavy elements, meaning everything heavier than helium. The team prefers another: a thick, patchy layer of water-ice clouds, something like the cirrus high in Earth's sky, muffling the light from below. Most models of these atmospheres leave clouds out, because clouds are hard to simulate. Other cold giant planets photographed so far are also too dim between 3 and 5 microns, which fits the cloud idea.
The new orbit fit puts the planet at 7.6 times Jupiter's mass, on a somewhat stretched orbit about four times farther from its star than Jupiter is from the Sun. Its diameter is about the same as Jupiter's. "If we were aliens, several light years away, and looking back at the Sun, JWST is the first telescope that would allow us to study Jupiter in detail," Matthews said.
Since then, a team led by R. Kravtchenko and O. Berné has gone a step further and taken spectra. The star's glare swamped the data, so they filtered out the smooth starlight and searched what was left for the fingerprints of specific molecules. In a preprint posted in September, they report clear detections of ammonia and water vapor in the planet's atmosphere, a weaker detection of methane and a hint of carbon dioxide. It hasn't been peer reviewed yet.
Water vapor isn't ice, so the spectra don't show the clouds directly. What they do give is a direct look at the chemistry of a planet this cold. The next test is whether a cloudy atmosphere can reproduce those molecular fingerprints along with the dim near-infrared light, or whether the ammonia puzzle needs a different answer.
3. 🕳️ Webb finds signs of three black holes feeding in one young galaxy
The galaxy J0148-4214 is so far away that its light left it about 12.5 billion years ago, when the universe was only 1.2 billion years old. It holds about 1.3 billion Suns' worth of stars, a modest amount for a galaxy. Yet a team led by Hannah Übler of the Max Planck Institute for Extraterrestrial Physics in Garching has found evidence for three feeding black holes inside it.
"This is the first evidence of three active black holes in a single galaxy in the distant Universe," Übler said.
Nobody can see a black hole that far away, or even the disk of gas swirling into it. What gives one away is its spectrum. Gas orbiting close to a feeding black hole moves fast, at hundreds to thousands of kilometers per second in this galaxy. Some of it is coming toward us and some going away, so the Doppler effect smears each of the gas's emission lines, the bright, sharp colors that glowing atoms give off, into a broad hump. The width of the hump tells you how fast the gas is moving, and its brightness hints at how far out it sits. Put the two together and you get a rough mass for the black hole.
The team used Webb's NIRSpec spectrograph in a mode that records a full spectrum at every point across the galaxy's image. The observations are part of BlackTHUNDER, a large Webb program studying black holes in the early universe. In the galaxy's center, the line of glowing hydrogen called H-alpha had a broad, lopsided shape. A single black hole didn't fit it well.
The team sliced the spectrum into narrow bands of color and checked where each slice's light came from. One part of the broad line came from one spot, and another part came from a spot slightly to the side. That was two separate swirls of fast gas, which appear only about 620 light-years apart on the sky, too close for Webb to see as two points of light. Their real separation could be larger, since we can't measure how far apart they are along our line of sight. A third broad H-alpha source turned up in the galaxy's outskirts, about 5,500 light-years from the center as seen on the sky.
Before calling them black holes, the team worked through the impostors: supernovae, shock waves, winds blowing out of the galaxy and very massive stars can all produce broad lines. One clue was oxygen. An ordinary wind blowing out of a galaxy usually broadens the bright oxygen lines too, and here they stayed narrow. Gas close to a black hole can be so dense that collisions between atoms suppress that oxygen glow, while hydrogen keeps shining. The team also tested unusually dense outflows and found them unlikely. Of the options they tested, black holes fit best.
The three are very different. The mass estimates are rough, uncertain by factors of a few, but the biggest comes out at about 80 million Suns. Its close neighbor is only about 600,000 Suns, and the one on the outskirts about 2 million. The smallest has the highest feeding rate for its size. Its estimated rate exceeds the Eddington limit, the point at which the light from the infalling gas pushes outward as hard as gravity pulls in. That limit is supposed to cap how fast a black hole can grow, though it isn't a strict wall.
The black holes also make up a sizeable share of the galaxy's mass. "We find a total stellar mass of about 1.3 billion suns, and the black holes represent a significant fraction of that," said Giovanni Mazzolari of MPE, the paper's second author.
The central pair should drift together. A simple calculation in the paper suggests the smaller one could sink toward its neighbor, dragged by the gravity of the surrounding stars and gas, in under about 700 million years. After that, other processes would have to tighten their orbit before they finally merge. The third black hole could be on its way in to join them. Or it could be the leftover of an earlier merger, kicked out of the center: when two black holes merge, they can send out gravitational waves more strongly in one direction, and the recoil can shove the new black hole sideways at high speed. If that's what happened, it carried its disk of glowing gas along with it.
"They suggest that black hole merging may be an additional, fast route for their rapid growth in the early Universe," said Roberto Maiolino of the University of Cambridge, one of the coauthors.
There are two ways to grow a black hole: feed it gas, or merge it with another one. Feeding is thought to do most of the work over cosmic history, but some simulations suggest mergers mattered a lot for certain black holes at certain times. Triplets of black holes are known in the nearby universe. J0148-4214 shows one already gathering in the first tenth of cosmic history. If the central pair does merge, it would make the kind of signal LISA, a space-based gravitational-wave observatory planned by ESA, is designed to detect. The team also points out that several other distant galaxies have the same lopsided broad lines in their spectra. Each might be hiding more than one black hole, and the same spot-by-spot spectra could test it.
4. 🧊 Something may be seeping up from under Pluto's heart
Pluto's bright "heart" has a western lobe called Sputnik Planitia. It's a glacier of frozen nitrogen larger than Texas and Oklahoma combined, filling a basin kilometers deep. When New Horizons flew past in July 2015, it showed that the glacier's surface is broken into cells about 20 to 35 kilometers across, where warmer ice slowly wells up from below and sinks again at the edges, a little like the surface of a simmering pot. The churning wipes the surface clean. No impact craters have been found there, and it's probably less than a million years old.
The northern end of the glacier has something else. Along the boundaries between cells run dark, narrow lines, typically tens of kilometers long. Around them spread broader, fuzzier dark zones, up to about 20 times wider than the lines.
Alan Stern of the Southwest Research Institute, who leads New Horizons, brought in glaciologists who study Earth's ice sheets. On satellite images of Greenland taken by Landsat 9, they found similar narrow dark marks in places where liquid water lies on top of ice and snow. Their paper in The Planetary Science Journal, published in July, proposes that Pluto's dark marks are wet too, with liquid nitrogen that rose from under the glacier.
It sounds impossible at first. Pluto's surface sits at about 37 kelvins, roughly minus 236 degrees Celsius. Nitrogen can't be liquid unless it's warmer than about 63 kelvins and under a pressure of at least 12.5 kilopascals, about an eighth of the air pressure at sea level on Earth. Pluto's thin atmosphere comes nowhere close, so it can't rain liquid nitrogen there.
The bottom of the glacier is another matter. A thick pile of ice presses down hard on itself. The paper calculates that the pressure under Sputnik Planitia passes nitrogen's minimum for a liquid only about 20 meters down. Further down, heat leaking out of Pluto's interior warms the ice. Depending on how much heat comes up, the bottom could start to melt somewhere between about 300 meters and 1.4 kilometers deep.
Computer models led by Orkan Umurhan of the SETI Institute follow what that liquid would do. Liquid nitrogen is less dense than solid nitrogen, about 870 kilograms per cubic meter against about 995, so it would tend to rise. It could force its way upward through cracks, like magma rising through a volcano's plumbing. The trip would take minutes to a few hours.
Once the liquid broke out at the surface, it wouldn't last long. Depending on how runny it is and how fast it pours out, it would freeze within about a minute to about a week. Even in the thickest, most sluggish case the team considered, a flow could still travel a kilometer from its crack before stopping, after about 20 hours. That's long enough to run downhill along the cell boundaries and spread over the ice around them.
As for why wet ice would look darker, the paper suggests two ways. Liquid soaking through the ice could make its grains much larger, and coarse ice reflects less light than fine frost. The liquid could also carry small amounts of dark impurities up to the surface.
"Pluto never stops surprising us," Stern said. The marks must also be fairly fresh. "The surface of Sputnik Planitia is quite young, probably less than one million years based on modeling of the surface overturn, and thus these features that we are looking at must have formed since then," said Kelsi Singer of SwRI, one of the coauthors. Stern calls it "a new kind of time-variable feature on Pluto." Earlier work, some of it his, had argued for liquid on Pluto only in the distant past. This would mean liquid nitrogen under the glacier now, or very recently.
The paper's title calls it "possible" basal flow, and that's the right word. The case rests on the shapes and darkness of features in pictures taken during one flyby, compared with features on Earth, plus models of how solid nitrogen behaves. Nobody has seen liquid on Pluto. And some of the physics is untested: "These processes have never been studied in real detail in the laboratory," said Umurhan, who wants experiments on how solid nitrogen melts when it's squeezed and strained.
There may be a relative elsewhere. When Voyager 2 flew past Neptune's moon Triton in 1989, it saw geysers. A similar kind of melting under nitrogen ice might help explain them. Pluto itself may hold more. No other region shows signs of this kind of flow so far, but more than half of Pluto has never been mapped in detail.
5. 🌌 A trail of stars weighs a galaxy we can barely see
Around the Milky Way, astronomers have found dozens of long, thin trails of stars. Many of them come from globular clusters, dense balls of old stars, which the galaxy's gravity slowly pulls apart as they orbit. The stripped stars don't scatter. They keep following nearly the same path as the cluster, one trail running ahead of it and one behind, and they keep that shape for billions of years.
That makes a stream a sensitive scale. "The stars in a stellar stream all travel along nearly the same orbit, and that orbit is shaped by the galaxy's gravity," said Tjitske Starkenburg of Northwestern University. "By modeling that gravity, we can estimate the galaxy's total mass."
Until this year, every stream like this was in our own galaxy. They're very faint, and at the distance of other galaxies they all but vanish. Julie Kiel Holm, a doctoral student at the Niels Bohr Institute in Copenhagen, and Sarah Pearson of DTU Space have now reported evidence for the first one found in another galaxy, in Nature in August. And they found it in one of the hardest places to look.
The host galaxy, UGC 9050-Dw1, is an ultra-diffuse galaxy. These are galaxies with about as many stars as a dwarf galaxy, spread over an area roughly as wide as the Milky Way. They're so faint that large numbers of them turned up only in the last decade or so, as cameras got better at faint light. They are also hard to weigh. The usual methods time how fast stars or gas move, and in such dim galaxies there's barely enough light to do it. Astronomers argue about them a lot. Some ultra-diffuse galaxies appear to have almost no dark matter, while others seem to be made of little else.
This one is about 115 million light-years away. In deep Hubble images taken to study its globular clusters, the team spotted a thin streak extending from one of them. The same streak shows up in separate images from the Canada-France-Hawaii Telescope, so it isn't a flaw in one camera. It's about 6,500 light-years long but only about 240 light-years wide, far thinner than any known stream torn from a dwarf galaxy, and its color matches the cluster it seems to come from. The team named the candidate stream Oyashio, after a cold current in the Pacific Ocean.
Then came the weighing. Stars leak out of a cluster where the galaxy's uneven pull beats the cluster's own gravity, and how wide and curved the trail ends up depends on both. The trail's shape, along with limits on how heavy the cluster can be, therefore constrains the galaxy's gravity. Using a method that fits computer models of streams directly to the picture, the team asked which combinations of cluster mass and galaxy mass could produce a trail of exactly this shape in exactly this place. Models that were too straight, too curved or too wide were thrown out.
What came out points to a globular cluster of at most 2.5 million Suns, a reasonable size for one, inside a heavy halo of dark matter, the invisible cloud of mass that surrounds a galaxy. The best-fitting models give the galaxy a total mass of about 150 billion Suns, similar to the Large Magellanic Cloud, though the uncertainty spans a wide range. That agrees with an earlier, independent estimate based on how many globular clusters the galaxy has.
The stream also says something about how the dark matter is arranged. Simulations of dark matter predict halos that get steeply denser toward the center. Many small galaxies look as if they have flatter, gentler centers instead. The fit to Oyashio suggests a center somewhat steeper than in typical faint dwarf galaxies, though the error bars are wide.
The authors call it "evidence for" a stream rather than a certain detection, which is fair for a single faint streak. Only one arm is visible. The models suggest the other one wraps around behind the galaxy's brighter middle, where it would be lost in the glow.
Pearson said the find means astronomers can now search for streams like this in other galaxies, and that "in the long term, we may also be able to measure the dark matter content of more ultra-diffuse galaxies."
6. 🌑 The Moon's great bombardment may never have happened
When the Apollo astronauts brought rocks home from the Moon, geochemists found something odd. Many of the rocks melted or reset by impacts gave ages close together, around 3.9 billion years. Older ages were rare.
Three of them, Tera, Papanastassiou and Wasserburg, offered an explanation in 1974 and called it a "terminal lunar cataclysm." The Moon, they suggested, had been hit by a sudden flood of impacts long after it formed. The idea grew into the Late Heavy Bombardment: a spike of collisions about 3.9 billion years ago, lasting somewhere between 20 and 200 million years, that carved the Moon's great basins and scarred Mercury and Venus too. Theorists later found a possible cause in a shuffle of the giant planets' orbits, which could have scattered asteroids toward the inner Solar System.
It became one of the big dramatic chapters of Earth's early history, and it carried weight in arguments about when life could have begun. But there was always a worry. The Apollo samples come from only about 4 percent of the Moon's surface, all of it on the side facing Earth. One alternative explanation was that many of them were debris from a single giant impact, the one that dug the Imbrium basin on the near side. If so, they would agree on a date for a dull reason.
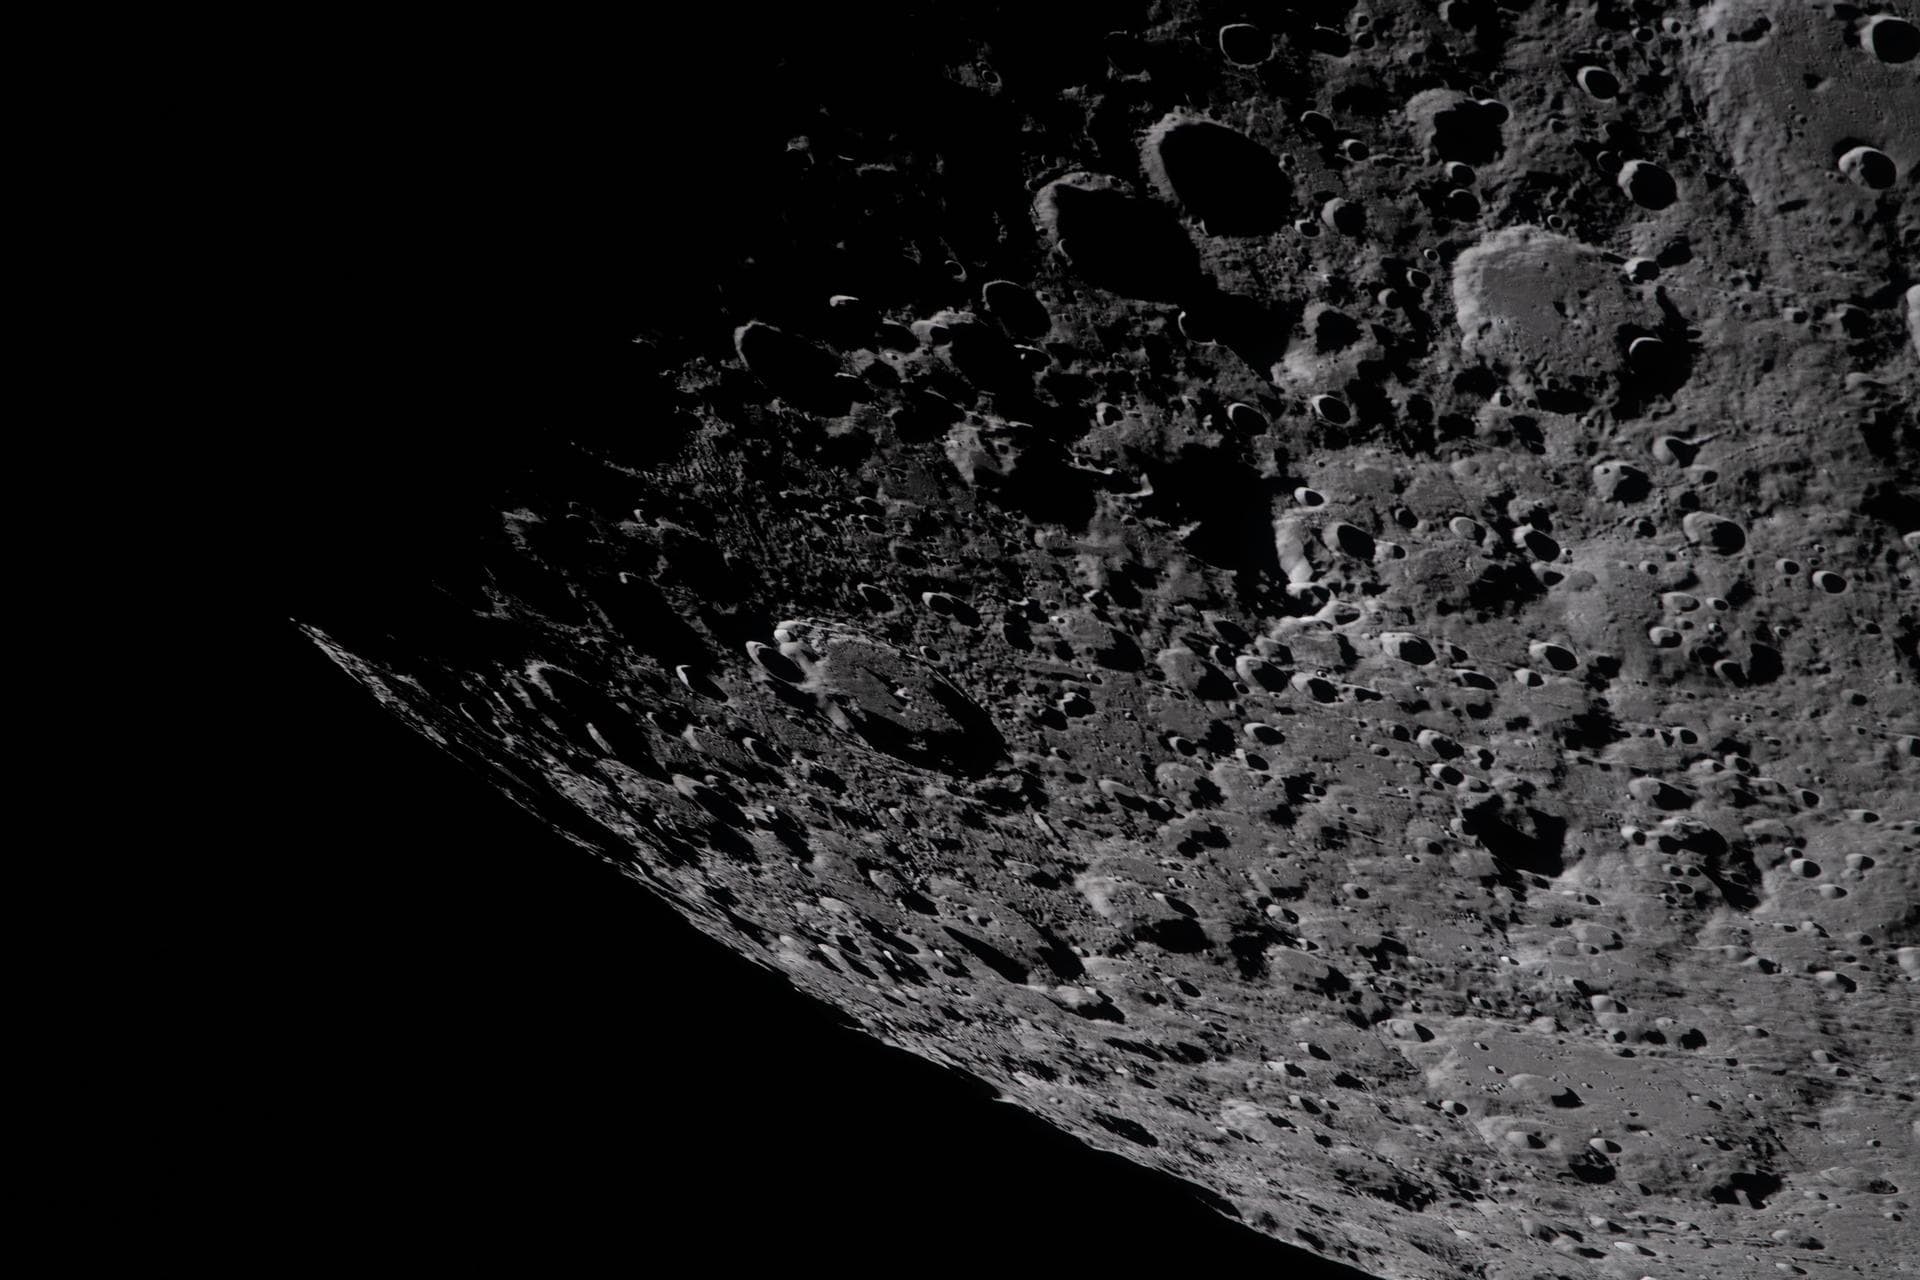
Patrick Boehnke and Mark Harrison of the University of California, Los Angeles, came at the problem from another angle in 2016. Many of the impact ages come from argon dating, which measures argon gas built up by radioactive decay inside a rock. A later impact nearby can reheat the rock and let some of that argon leak out, making it look younger. Almost every Apollo sample has been disturbed this way.
Boehnke and Harrison simulated it. They gave the Moon an impact rate that only ever went down, with no spike at all, let later impacts reheat the rocks at random, and then "dated" the results the way geochemists would. A false peak appeared between 3.5 and 4 billion years ago anyway. They concluded that a steadily falling rate of impacts can explain all the existing argon ages, and that reading the cluster as a real spike is probably a mistake. They were careful to add that this doesn't rule a spike out.
What the argument needed was a rock from somewhere else, and in 2024, China's Chang'e-6 mission brought back the first samples from the Moon's far side. It landed in the Apollo basin, inside the South Pole–Aitken basin, the largest and oldest known impact basin on the Moon, on the opposite side from every Apollo site.
A team led by Chen Yi of the Chinese Academy of Sciences sifted about 1,600 fragments from two soil samples and picked out 20 bits of a rock called norite that looked like they had crystallized from melt made by a huge impact. They dated them with a different clock, the lead that builds up from uranium decay in tiny zirconium-bearing minerals inside the rock. It gave two events: one at 3.87 billion years and one at 4.25 billion. The older rocks showed signs of having cooled at different depths in one great pool of melt. Chen's team concluded that 4.25 billion years marks the impact that made the basin, about 320 million years after the Solar System was born.
On its own, an old basin doesn't rule out a later storm. The test is how the Moon's craters pile up over time. Astronomers date unvisited parts of the Moon by counting their craters: more craters, older ground. That only works if the counts are tied to surfaces whose ages are known from returned rocks, and until Chang'e-6, every one of those came from the near side.
In February, a team led by Yue Zongyu of the Chinese Academy of Sciences added two far-side anchors: the basin's 4.25-billion-year-old melt and the local lava, which the samples date to about 2.81 billion years. With those added, they rebuilt the calibration that converts crater counts into ages. The far side fits the same curve as the near side. And the impact rate they reconstruct falls smoothly and quickly through the Moon's early history, with no peak at 3.9 billion years. The 4.25-billion-year rocks don't fit the cataclysm, and they don't fit an in-between version either, with smaller surges stacked on a decline.
I don't think one basin settles it. It's one landing site, one basin age and one calibration, and other groups will have their own readings. NASA's own summary says the debate continues. But the case for a single great storm of impacts has rarely looked weaker. It now seems more likely that the inner Solar System calmed down gradually, as planet-building tapered off. The Apollo rocks may have been telling us mostly about Imbrium.
7. 🌌 Dark energy may be running down
The light from Tycho's supernova helped change astronomy once. Its kind of explosion did it again at the end of the 1990s. Two teams measured the distances to Type Ia supernovae in faraway galaxies and compared them with how much the galaxies' light has been stretched by cosmic expansion. That tells you how fast the universe was expanding at different times, and they found that the expansion is speeding up. Whatever is doing the pushing was given the name dark energy, and the simplest version of it is Einstein's cosmological constant: an energy that belongs to empty space itself, so every cubic meter of space holds the same amount forever, even as the universe expands.
For a quarter of a century that simple version fit. Now several measurements are leaning, tentatively, another way.
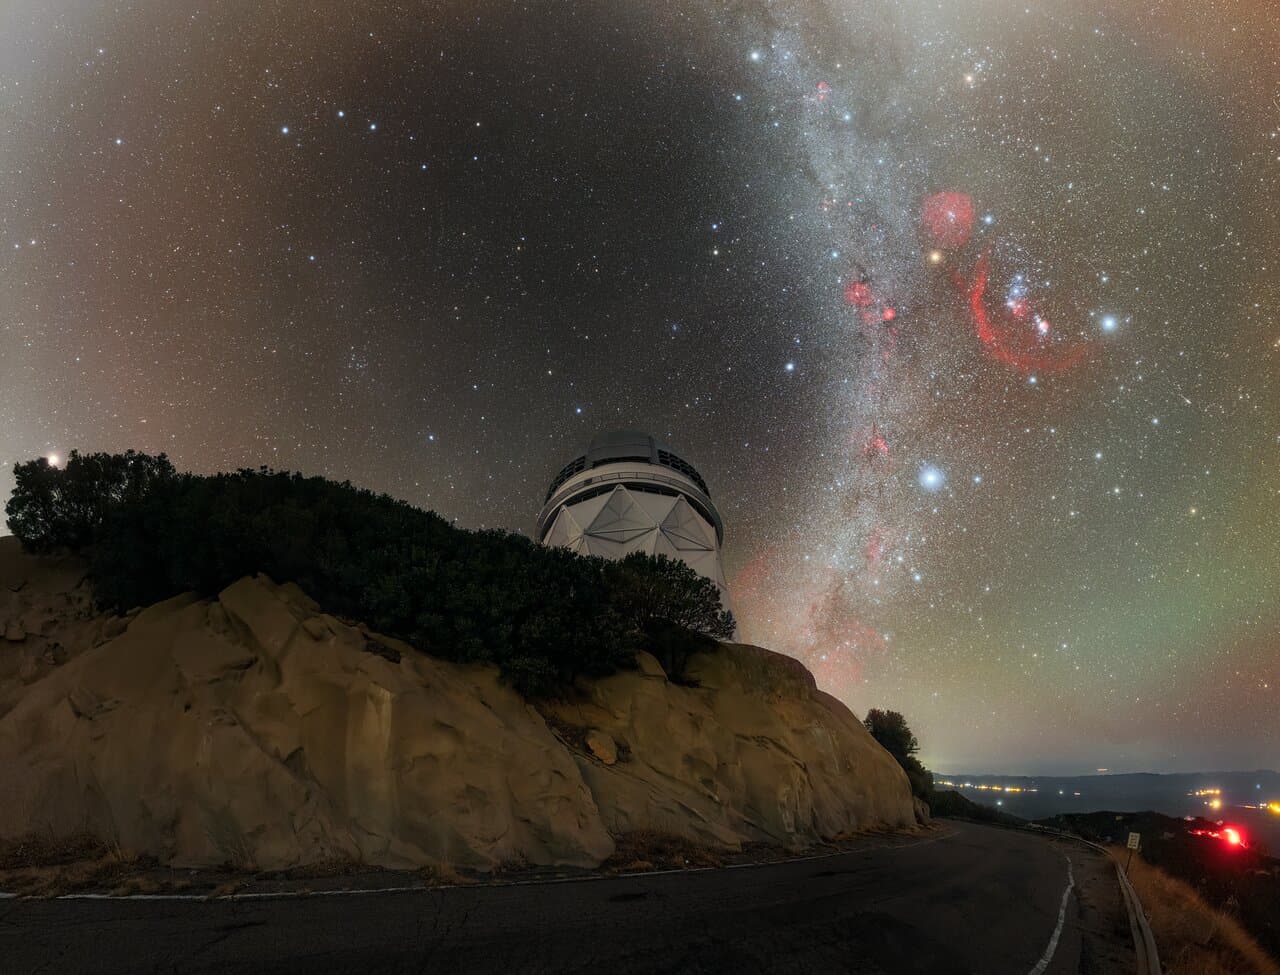
The first came from DESI, an instrument on the Mayall telescope at Kitt Peak in Arizona that can record the light of 5,000 galaxies at once. It measures a pattern in how galaxies are spread out, left over from sound waves in the early universe, and uses it as a ruler to track the expansion over the past 11 billion years. In March 2025, using nearly 15 million galaxies and quasars, the DESI collaboration reported that when its data are combined with supernovae and with the cosmic microwave background, the faint afterglow of the Big Bang, the impact of dark energy may be weakening over time. Depending on the combination, the preference ranged from 2.8 to 4.2 sigma. Sigma measures how far the data stray from the constant-dark-energy model, given the analysis's assumptions; physicists usually want 5 before calling something a discovery.
"We're guided by Occam's razor, and the simplest explanation for what we see is shifting," said Will Percival of the University of Waterloo, one of DESI's spokespeople.
Supernovae are the other main line of evidence, and the story there has been bumpier. The Dark Energy Survey's five-year sample of supernovae, released in 2024, pointed the same way and contributed some of the strongest numbers. Then its team did the unglamorous work of rechecking the calibration: how brightness is compared between telescopes, how light curves are modeled, and a small numerical approximation that turned out to need fixing. With the recalibrated sample, posted last November, the significance combined with DESI and the microwave background fell from 4.2 sigma to 3.2. The team called what remained "only a weak preference for evolving dark energy."
That's the kind of thing that keeps cosmologists careful. If dark energy really were constant, random noise alone would produce a 3-sigma departure only about 0.3 percent of the time. That number says nothing about mistakes in calibration, though, and as DESI's own announcement noted, many 3-sigma results in physics have faded away with more data.
A cross-check came in May, from the Dark Energy Survey's own full set of measurements, which adds the slight bending of light by matter and the clustering of galaxies. Combined with DESI and the microwave background, it leans the same way at about 3 sigma, and it still leans at 2.6 sigma with the supernovae left out entirely. That version doesn't depend on getting supernova brightnesses right, though it still shares DESI's maps and the microwave background with the other analyses, so these aren't fully independent tests.
The newest step came from Australia in September. Ryan Camilleri, a doctoral student at the University of Queensland, and Tamara Davis and their colleagues merged two major supernova compilations, Pantheon+ and the Dark Energy Survey's five-year sample, into a single consistent set called Unite. It holds 2,884 likely Type Ia supernovae. "We've rebuilt 3 decades of astronomical observations into a single, consistent framework," Camilleri said. Combined with the microwave background and the galaxy maps, it shows strong tension if dark energy is forced to behave the same way forever, and the tension eases if it's allowed to change. What changes in those fits is dark energy's pressure compared with its energy density, the relationship that sets how it pushes on the expansion. The preference is 3.3 sigma by one statistical yardstick, while another kind of test, which penalizes the extra flexibility of the changing model, finds only weak support for it.
Davis noted that the different datasets don't land in exactly the same place. "Our supernova data from DES in 2024 first showed hints that dark energy may be time varying, and this new compilation also sees a deviation from the standard model although in a slightly different direction," she said.
None of this is a discovery yet, and I wouldn't bet the house on it. The signal has moved as calibrations improved, and the methods used to describe a changing dark energy are simple stand-ins for physics nobody has worked out. But I find it hard to wave away when different instruments, measuring different things, keep leaning the same way.
If dark energy is a true constant, the acceleration never stops. If it's changing, nobody knows yet how the universe ends. "Whatever the nature of dark energy is, it will shape the future of our universe," said Michael Levi, DESI's director. DESI finished mapping all the sky it had planned in April and will keep going through 2028. A new supernova program called DEBASS is filling in hundreds of nearby explosions to sharpen the yardstick. The first dark energy results from DESI's full five-year survey are expected in 2027.
🌙 One last thought before you sleep
Tycho's star broke an old belief that the sky never changes. Explosions of the same kind are now testing a newer one, that the energy of empty space never changes either. I don't know which way that will go. I do like that the evidence will come from the same kind of light Tycho watched fade in 1572, collected by people who now read it far more closely than he could.
That's all for tonight. Thanks for wondering along with me. Good night, and clear skies. 🌌
— Kasi